|
|
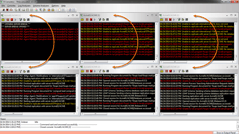
Open multiple console instances to multiple servers in the same consoleEZ session.
|
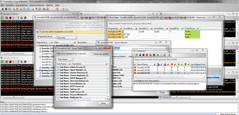
Multiple live consoles, a dashboard view and powerful analytics
|
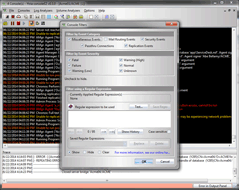
Decide what type of events to display.
|
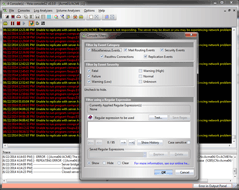
Turn your console into a to-do list by only showing errors of certain severity levels.
|
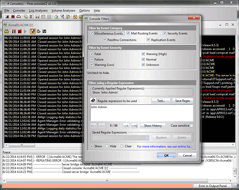
Apply a Regular Expression filter to show or hide certain events.
|
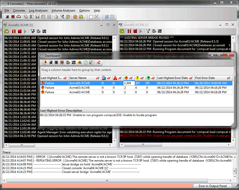
Keep an eye on your servers at all times.
|
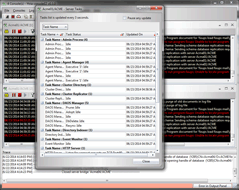
Manage Server Tasks.
|
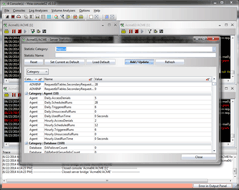
Access Server Statistics.
|
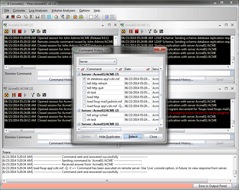
Choose from a list of previously sent commands.
|
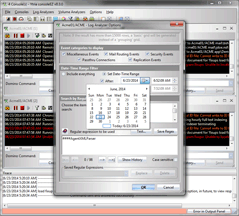
Add multiple NSFs to one analyzer session.
|
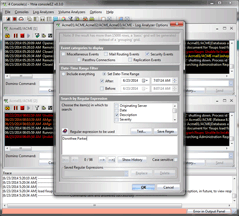
Search by a particular event type like Security.
|
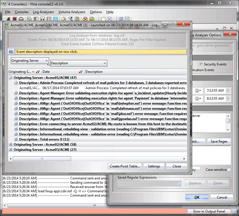
Specify a precise date-time range to search log events.
|
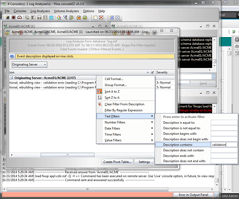
Search specific columns using Regular Expression.
|
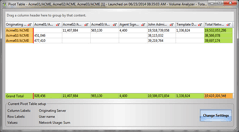
Find and understand the total network volume sent and received by individual users per server.
|
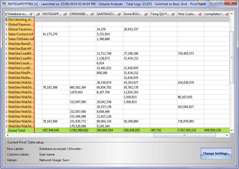
Use a pivot table to analyze usage activity and bandwidth use.
|
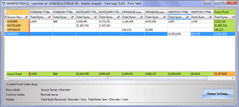
Use a pivot table to analyze what was sent and received by servers.
|
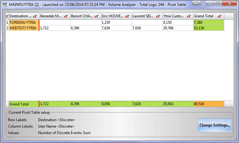
Use a pivot table to analyze passthru connection events.
|
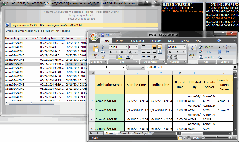
Conduct a replication volume analysis and export to Excel.
|
|