Selected Error List
This option loads your selected Domino error events in a grid, and gives you the ability to load the
Log Analyzer for a specific event.
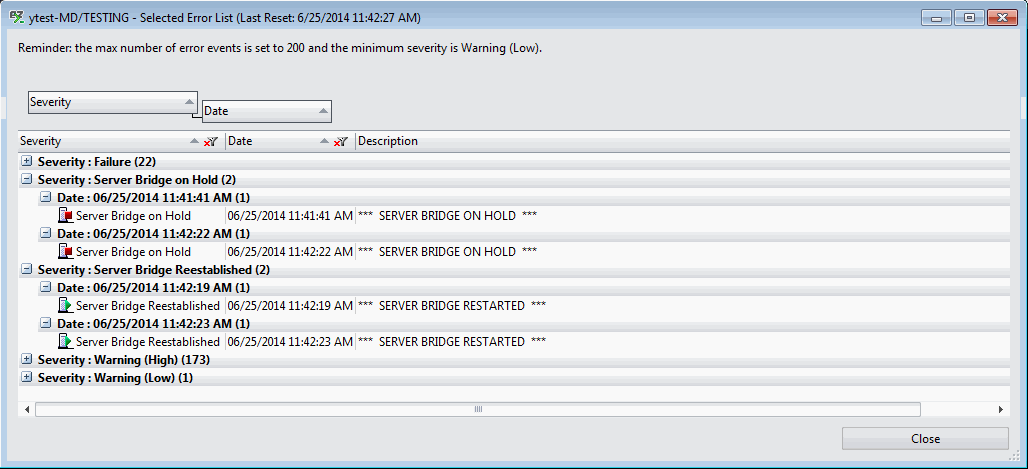
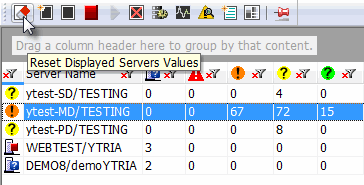
| Note | The last reset occurs after selecting from the Dashboard's 'Reset Displayed Servers Values'.
 |
|---|
Open Selected Error List grid
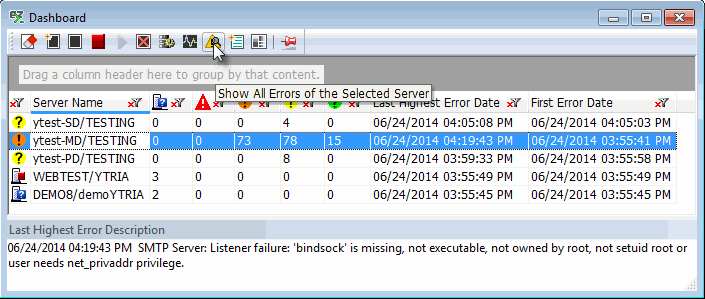
- By using the Dashboard's Show All Errors of the Selected Server toolbar icons.
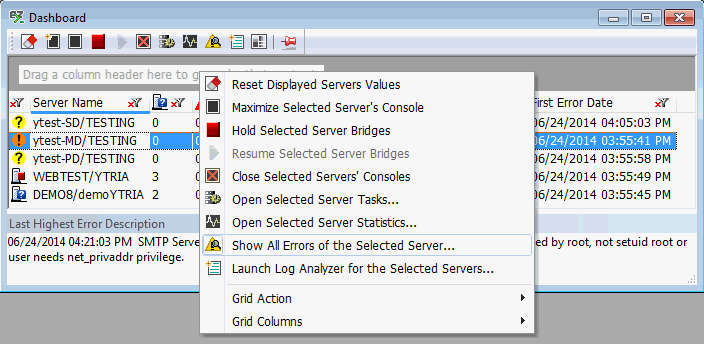
- By using Show All Errors of the Selected Server in the right-click options.
- By selecting and double-clicking a server displayed in the Dashboard's grid.
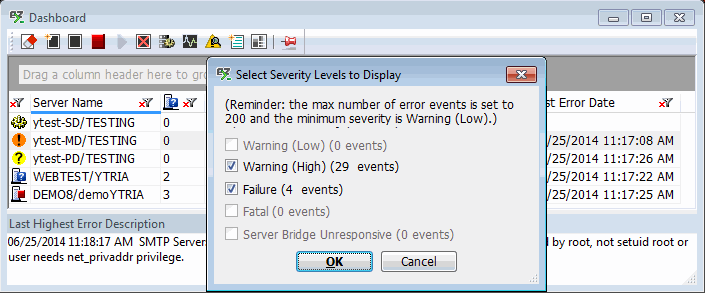
| Note | The 'Selected Error List' grid will be loaded with the Severity Levels pre-chosen. |
|---|
Grid right-click options - Tools and Columns
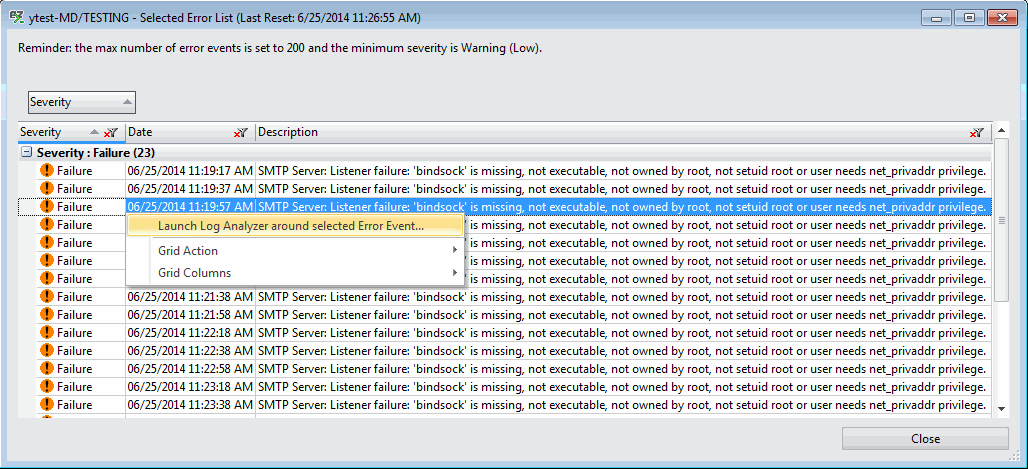
- Launch Log Analyzer around selected Error Event: You can select an error in the grid and then run the Log Analyzer.
 Tip Tip | You can define the maximum number of events loaded in the grid by doing: Options / Preferences / Max error events to keep in Dashboard memory.
More information about consoleEZ's Preferences can be found here.
|
|---|
More information about Grid Tools and Options is
here.
The
Selected Error List Grid includes the following columns:
| Severity | Error Severity. |
| Date | Date and Time value. |
| Description | Error Description. |
More information about Grid Columns is
here.