Establish Server Downtime and ID Irregular Shutdowns across All Servers, in Three Clicks

After receiving a very thought-provoking question from one of our customers faced with the time-intensive task of tallying up server downtimes, we decided to see if we could work out a solution to this dilemma. In the end, the process revealed itself to be quite easy, and we thought sharing it would be beneficial to anyone responsible for overseeing Domino, Sametime, or Traveler servers. First, let’s take a look at the situation.
Fig. 4 Select only Miscellaneous Events in the Log Analyzer Options dialog to optimize the tool’s performance for this case, and then input the regex “Server shutdown complete|IBM Domino \(r\) Server started, running Release“.
The Problem
This particular customer’s task was to calculate server downtimes every week. This required them to dig into each server’s log file, seek out a particular string to pinpoint server restarts, and then look at the log context and manually (!) export lines to an Excel sheet—all so they could add up the elapsed time for each instance the server had been down to finally arrive at the total time. They were rightly complaining that this process took hours and hours of administrator time each week; they needed a better way to do it.
The Task at Hand
To determine the length of time it took for a given server to come back up, we need to find two specific events: the event that identifies a server shutdown, and the event that shows when the server started back up. By calculating the elapsed time between these two events, we’ll get the exact amount of time that a given server was unavailable.
For starters, we’ll need to look into our log.nsf file for the two expressions that flag the events in question. For server shutdowns, the expression to find is “Server shutdown complete” (see fig. 1).
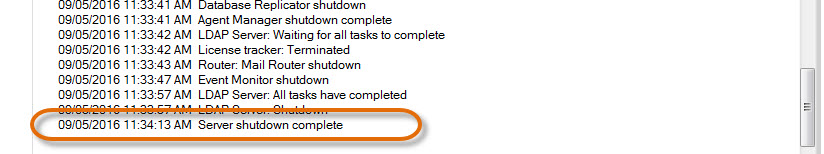
Fig. 1 The expression that flags a server shutdown is “Server shutdown complete”
For server start-ups, the expression we want to find is “Lotus Domino (r) Server started, running Release 9.0.1FP5″. But, to accommodate different versions in our search, we can simply look for “Lotus Domino (r) Server started, running Release” (see fig. 2).
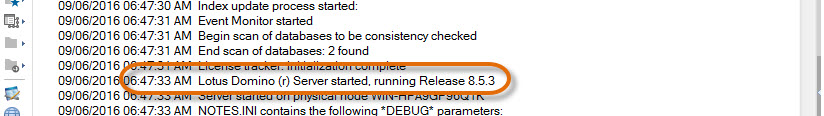
Fig. 2 Searching the expression “Lotus Domino (r) Server started, running Release” will return start-ups of any server version.
The first issue with the method described above, is that the dates and times aren’t readily available from the log file; one would need to search for both expressions, one after the other, open each matching document, do a CTRL+F to find the appropriate line, and finally export the date and time. This obviously takes a great deal of time. Complicating this situation even further is the fact that server start-ups don’t always follow a successful server shutdown. For each start-up event that isn’t preceded by a shutdown event, we’re looking at a crash, and we need to figure out when the crash occurred.
Luckily, consoleEZ can get us out of this jam. Beyond the fact that it allows us to search for both of these terms simultaneously, it also lets us extend that search over as many servers as we want. Additionally, our searches will be organized chronologically, allowing us to identify crash events immediately. Let’s take a look at how this works.
The consoleEZ Way
Since consoleEZ allows us to search multiple server logs simultaneously, we’ll be able to get all of this done in one pass. First, we need to open consoleEZ and launch Log Analyzers for each server we want to parse. This can be done with a CTRL+N, or by selecting the Log Analyzers > Choose Servers option (see fig. 3).
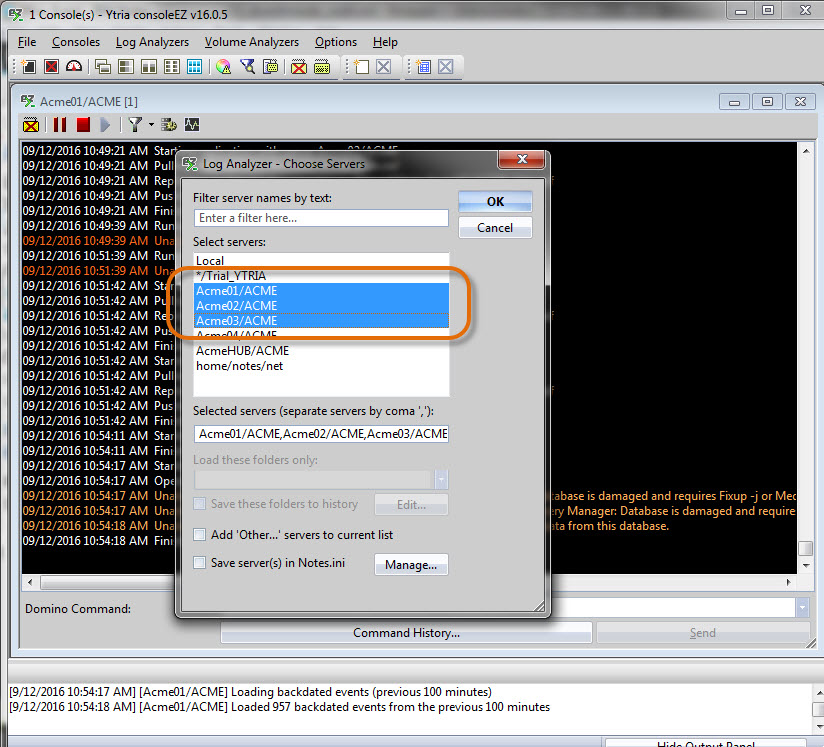
Fig. 3 Both CTRL+N and the Log Analyzers > Choose Servers option will bring up the Choose Servers dialog.
For this case, we’ll make sure that only Miscellaneous Events is selected in the top section of the Log Analyzer Options window. This will help to optimize the tool’s performance. Next, we can select our desired Date-Time range. In order to use the entire contents of log.nsf, we’ll need to select Include Everything.
Then, in order to look for the two events mentioned above, we’ll enter this regular expression:
Server shutdown complete|IBM Domino \(r\) Server started, running Release
Note that we must use a “|” character to separate our expressions, and we’ll need to use the “\” escape character to search for the (r) string with a regex. Thus, \(r\) (see fig. 4).
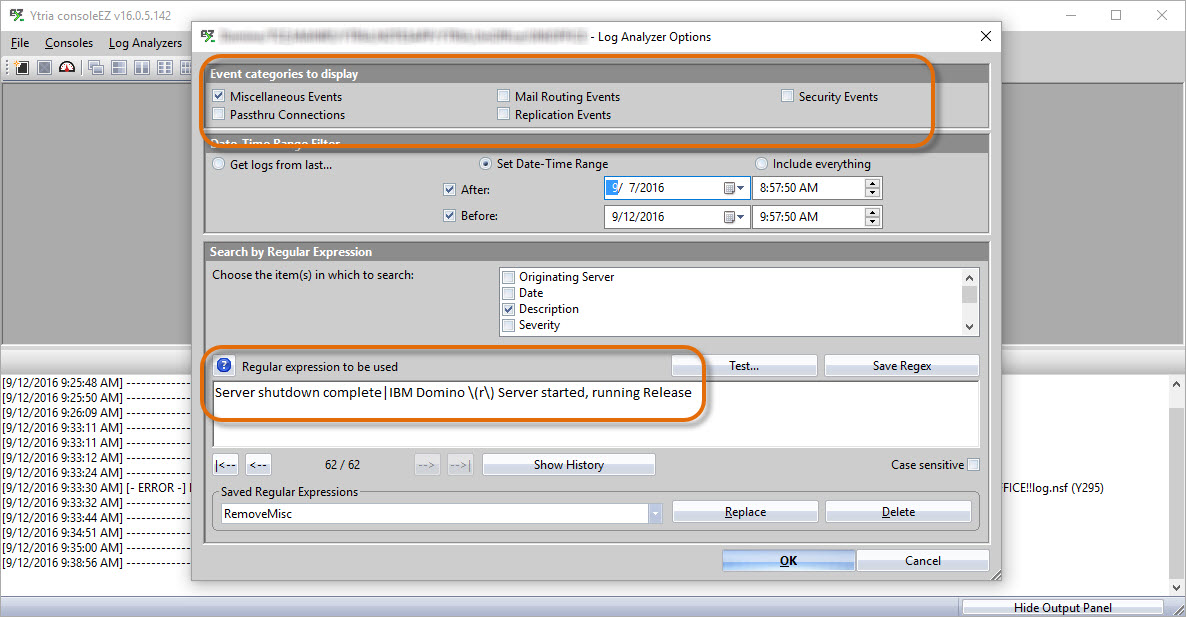
Fig. 4 Select only Miscellaneous Events in the Log Analyzer Options dialog to optimize the tool’s performance for this case, and then input the regex “Server shutdown complete|IBM Domino \(r\) Server started, running Release“.
Once our search has completed, we’ll see a readout of all matching events in the flexYgrid enabled Log Analyzer panel. This means we can categorize our matches by server, and then sort the events by time. Ideally, this would leave us with a clean chronological layout of shutdown and start-up events. But as the majority of us will probably see, there will be some surprises—such as two successive start-up events without a corresponding shutdown event (see fig. 5). In these cases, we’ll need to look for a crash event somewhere between them.
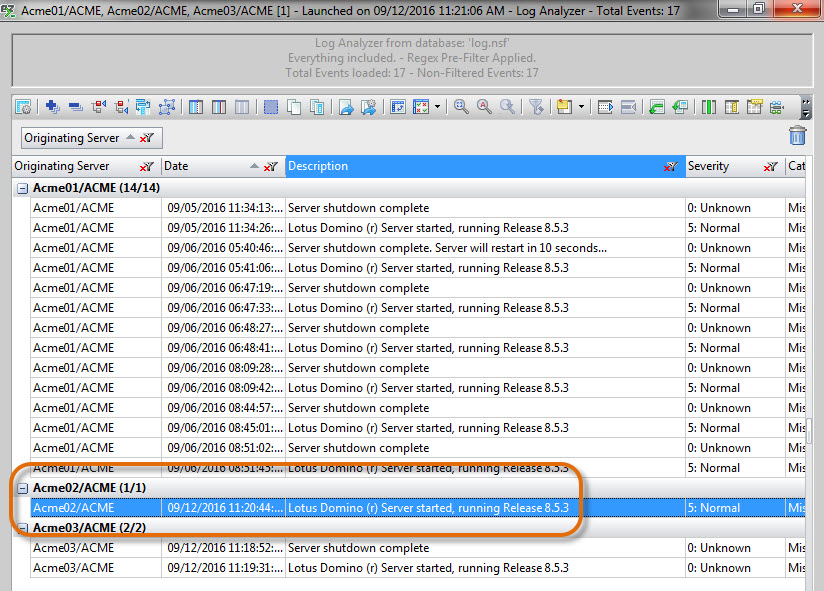
Fig.5 Server start-up events that lack a corresponding shutdown event are indicators that a crash took place.
In the case of a crash (once again, indicated by a set of server start-up events without a corresponding shutdown event between them) calculating downtime requires us to find the last time that the server was up and running. This sounds harder than it actually is, due to a certain characteristic of log documents: when a server goes down unexpectedly, the log document item FinishTime (which normally shows us the time of the last event per document) won’t be created.
To find out when the crash occurred, all we need to do is use scanEZ to look for any log documents that use the “Event” form and that lack the item FinishTime. Note that the log document currently open by the server won’t have this item yet, so we need to exclude this document from our search.
We can find these documents in only a few steps. Open scanEZ and select the Search by Formula option from the Search menu. Then, enter the following formula:
SELECT Form="Events"&FinishTime=""
When we apply this formula to our example above, we’ll find two log documents on the server Acme02/ACME, one of which is our current log document (see fig. 7). Now, let’s put the documents into a My Selection folder and use the StartTime item value to set the displayed title.

Fig. 7 Applying the formula SELECT Form=”Events”&FinishTime=”” will return 2 documents, including the current log document.
Set up in this manner, the latest date shown in our My Selection folder will be our most current log document—this we’ll disregard. Looking at the EventList item’s last time stamp for the remaining document will give us the last time that the server was available (see fig. 8).
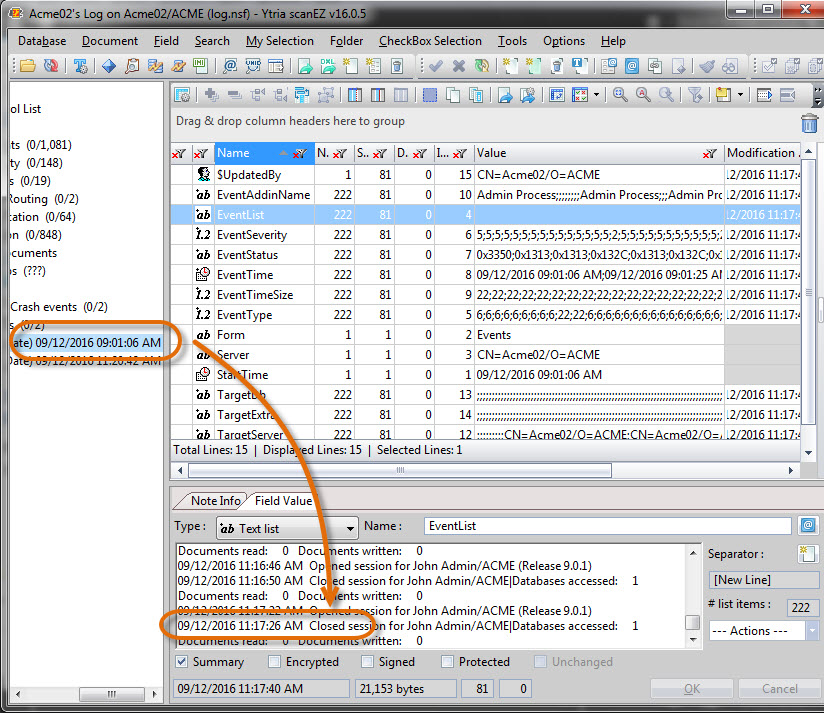
Fig. 8 If we disregard the most current log document, the EventList item’s last time stamp in the remaining document will give us the last time the server was available.
If you have a larger number of documents:
If there were more documents involved, it would be a good idea to set the My Selection folder’s displayed titles to automatically display the date and time of each log document’s last event. We can do this by simply right-clicking the My Selection folder, selecting Change Displayed Title, choosing Formula from the list of options, and then when prompted to enter a formula, using this: @Subset(eventTime;-1)
Once the operation has completed, we can use the Copy Tree Titles to Clipboard function to get the list of last event times onto our clipboard, and then simply paste it into an Excel sheet.
We’ve encountered several customers who’ve needed to create server-downtime reports on a weekly basis; all agree that completing this task requires a multiple-hour time commitment each week. Following the steps outlined above to export our results from consoleEZ (only a CTRL+C & CTRL+V once the filters have been applied) will give us a chronological timeline of server shutdowns and start-ups—calculating downtime is a cinch. And by looking at our Excel sheet, we’ll quickly spot any times where a server start isn’t followed by a proper shutdown event—a clear indication that we need to search for a crash (see fig. 9). At that point, scanEZ will play a very important role.
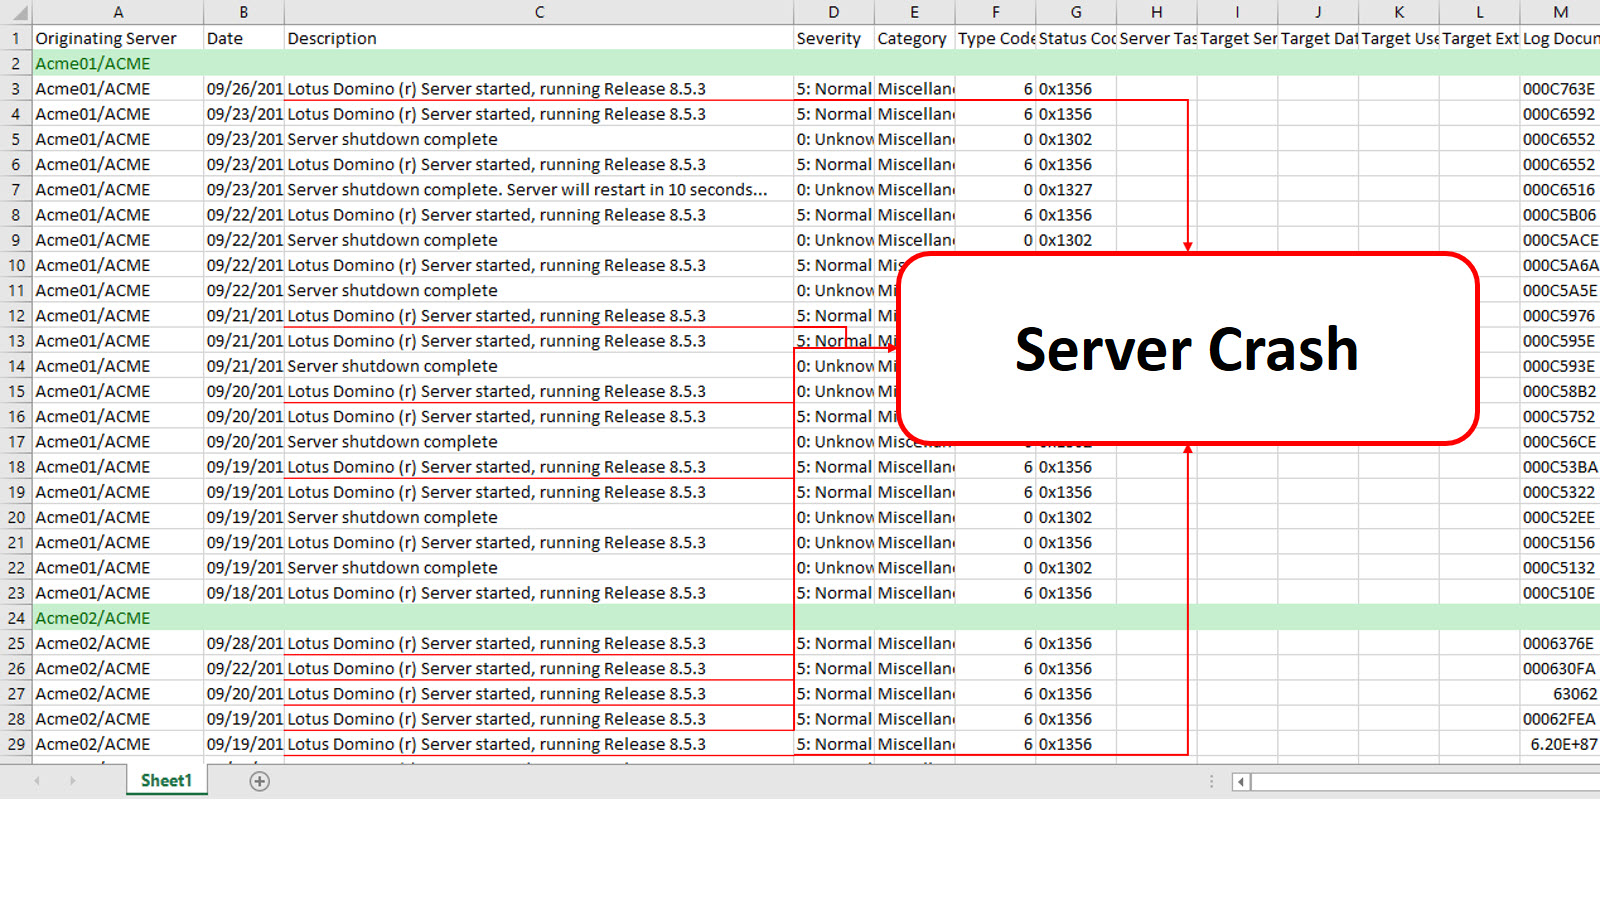
Fig. 9 A server start that isn’t followed by a proper shutdown event is a clear indication that we need to search for a crash.
Once we’ve established the dates and times of the crashes, all that is left to do to complete our downtime report is to insert new rows between server-start events and add in the last event time from the log document (see fig. 10).

Fig. 10 To finish off the report, simply insert new rows between server-start events and add the last event time from the log document.
And there you have it, a thorough server-downtime report completed in a time that’s a far cry from the hours spent in any traditional method—all thanks to EZ Suite.
Submit a comment