Understand your Domino log file architecture and navigate the ocean of data with consoleEZ

Searching the Domino log file can sometimes feel like you’re drowning because of the sheer volume of data. It’s a tedious task we all have to do on a daily basis; whether it’s finding an email, troubleshooting agents, or trying to understand what applications are being used.
Unfortunately performing most of these tasks without a 3rd party solution is so hard that you’re probably better off writing an agent to extract the data.
Although there is guidance from IBM available, consoleEZ offers a simpler solution.
In this article we will be focusing on session usage, replication and passthru log documents, and how you can get a better handle on them.
Log file architecture
Session usage and replication events are documented on a “per user, per session” basis.
This means that a specific user opening a new session and accessing (reading from and/or writing to) 10 databases will result in events being logged in one physical log document. These log documents are listed in the “Usage” views and can be read using the “Session” form.
Similarly during replication, once a replication session is opened by Server A, which may be within a cluster or in a standard replication configuration, everything that happens during that session (e.g. 10 databases replicated) will be logged in the same log document. These log documents are listed in the “Replication Events” view and can be read using the “Replication” form.
Note that passthru connections are logged differently. This is because these documents store a list of passthru events that happened during a larger time span. These documents are listed in the “Passthru Connections” view and can be read using the “Passthru Connection” form. This is stored in the same way as miscellaneous events and mail routing logs.
Let’s take a closer look at a session document to find out what information is stored (Fig. 1).
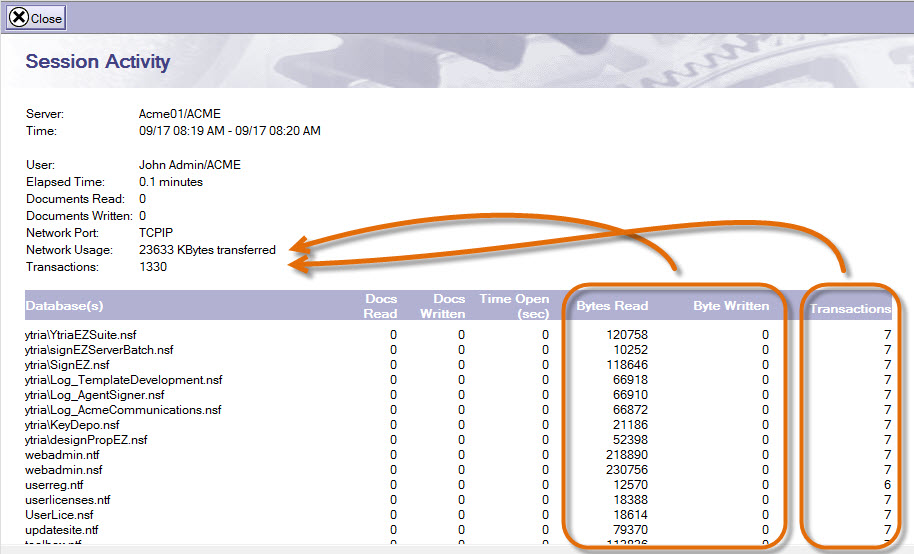
Fig. 1 Information stored on a Session Activity (Usage) log document.
For this session of the user John Admin, we have the following high-level information (Fig. 1, top left):
- User name
- Total # of documents Read
- Total # of documents Written
- Network Port
- Network Usage (grand total of kilobytes sent and received from the server)
- Total # of transactions
Then, in the lower section (Fig 1.), we find all the details of this session listed by database that John opened. For each database event, we have the following “discrete” information:
- Database path
- Documents Read
- Documents Written
- Time Open
- Bytes Read
- Bytes Written
- # of transactions
Note that every discrete event value is stored together within one text field in the log document.
These events (recorded per database) make up the high level statistics stored in the log document (e. g. Total # of transactions).
What is the problem with this?
If, for example, you want to calculate the total network traffic generated by a specific database or all the databases accessed during the day by a specific user, it can get extremely tricky. This is due to the logic used by Domino; all you can really use is the high level information stored in each log document.
So the problem rests in that you can’t view each database’s detailed information separately. This is because each database’s discrete values are agglomerated into one field, and Domino does not provide a way to retrieve them individually.
How does consoleEZ help?
Ytria’s consoleEZ will display the information of the log document at the “discrete values” level. In other words, unlike the Domino high level presentation, the consoleEZ grid will display one line per discrete event.
This allows you to group or summarize log information any way you want.
Note that each column containing any discrete values will have “” appended to its column name so you can easily identify it (Fig. 2).
Also, the high level information of the log document will be repeated in additional columns on each corresponding discrete event line.
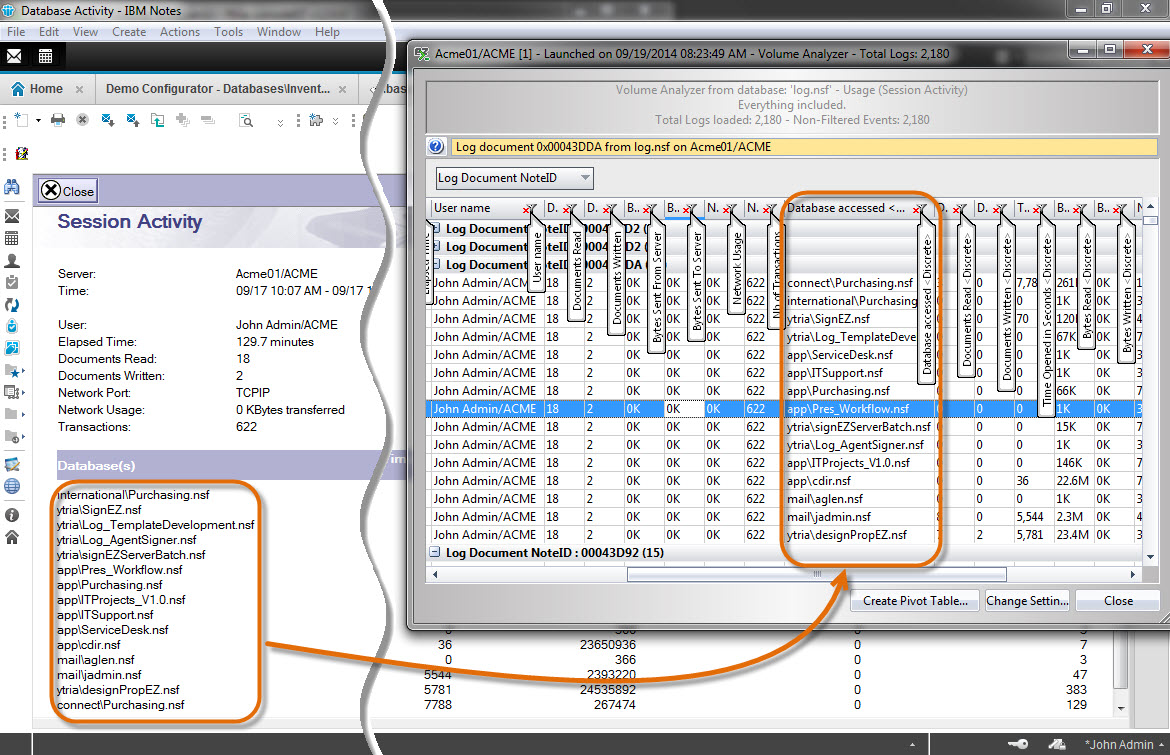
Fig. 2 Summary and discrete values displayed in separate columns in consoleEZ.
Basic example
Use the consoleEZ’s Volume Analyzer to get the log category “Usage (session activity)” for a given time period.
Group by the columns “User name”, and then by “Database accessed ”.
This results in obtaining the databases accessed per user for the selected period (Fig. 3).
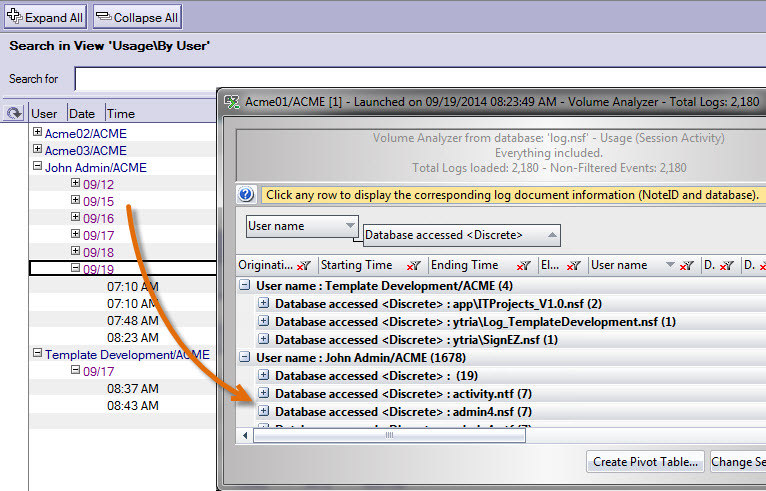
Fig. 3 Databases accessed per user within a certain time range displayed in Session Usage Volume Analyzer.
Further grouping can help us quickly answer questions like:
- What are the databases used by most users?
- What is the average session time & amount of databases accessed?
- Etc.
Pivot tables in consoleEZ
What if we wanted to summarize all these discrete events in several specific ways?
Pivot tables provide a summary of what your data represents.
Click the “Create Pivot Table” button in any populated grid, select the grid columns to set as pivot table rows, columns and values and let consoleEZ do the rest of the work for you.
To put this into perspective, here are a few hands-on examples on how to use pivot tables from the consoleEZ analyzers.
Example 1 – How much has been replicated (in bytes), and from where to wher
Sometimes replication doesn’t occur as it should because of the replication configuration between servers. Although replicationEZ can help you find out how your applications replicated (see more on this and other replication-related tools in our webcast recording), it relies on Replication History data and does not tell you how much was replicated.
To answer this question, we’ll use consoleEZ. Using the “Create Pivot Table” feature in its Replication Volume Analyzer will show how much traffic was actually generated between servers.
First, we launch the Volume Analyzer and select several servers at once. The Log Category to analyze is “Replication Events”. We then get the resulting grid with all our discrete events.
With the large volume of data gathered, the resulting grid may become overwhelming. This is when building a pivot table clears things up to give you a summary of your replication volume per database, server, etc…
For this example, we need the originating server, the receiving server, and the quantity of information both sent and received.
So we set:
- “Target Server <Discrete>” as Rows,
- “Source Server <Discrete>” as Columns,
- “Total Bytes Sent <Discrete>” and “Total Bytes Received <Discrete>” as Values.
The result reveals how much data has been sent and received by server origin and destination (Fig. 4).
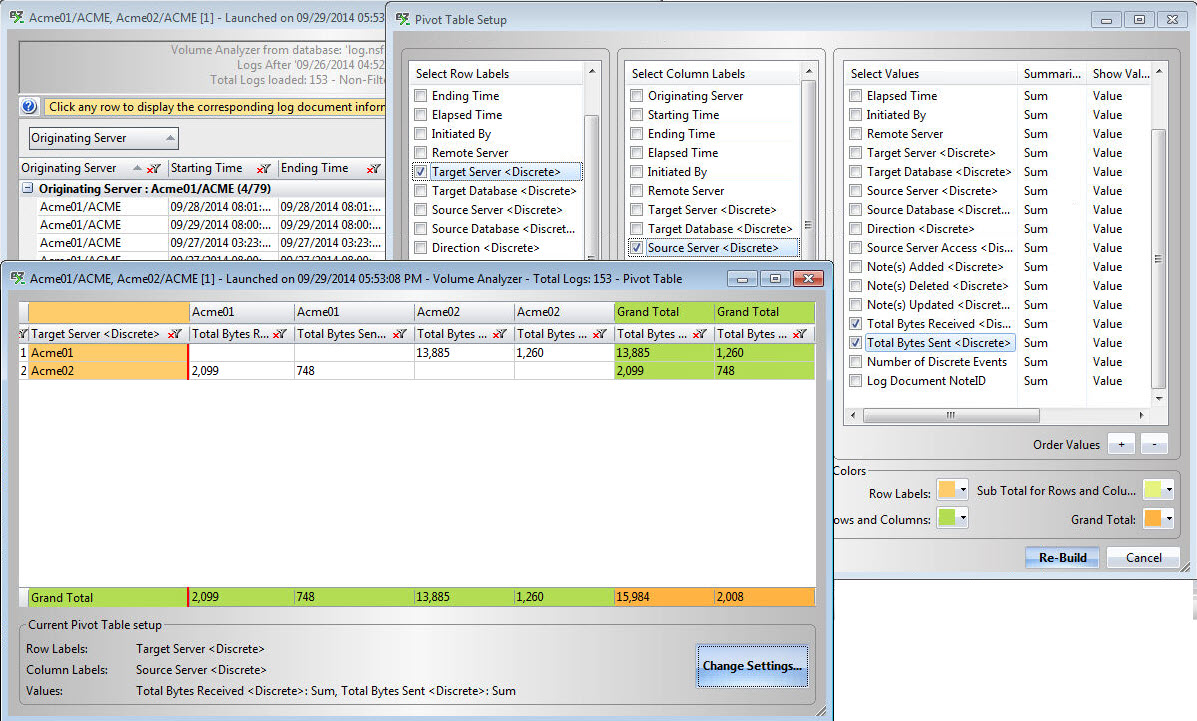
Fig. 4 How much has been replicated (in bytes), and from where to where via the Volume Analyzer.
When you’re a consultant responsible for administration and maintenance of a Domino environment, it can be difficult to take a quick picture of the environment before you go in and then to compare this to the global picture after you have finished your assignment. What Domino servers report as problems can be a good indicator of the overall situation. However, using the standard interface makes it almost impossible to oversee this.
You can also turn your consoles and log file content into a to-do list by using consoleEZ’s Log Analyzer and various filters. It becomes easier to prioritize corrective actions once you have the whole picture of your server events. And if you’re looking to analyze logs from multiple servers, which entails much more data to process, you can use a pivot table in the Log Analyzer to get a clear summary of the various severity events across servers.
Note that for each of these cases we want to create a quick picture of the health of our servers. To do this, we need to know how often each severity level error was encountered per server.
First, we create a Log Analyzer and select several servers at once. Then from the resulting grid, we create a pivot table with:
- “Severity” as Rows,
- “Originating Server” as Columns,
- “Description” as Values. Note that since this is not a numeric value, “Count” will be used instead of “Sum”.
The pivot table will now show you the count of each severity level (rows) per server, the Grand Total of unique events per server (bottom row), and the Grand Total of events across all servers (last column) (Fig. 5).
Repeat this for different time ranges, and you will have an easy way to compare states of your environment’s server health.
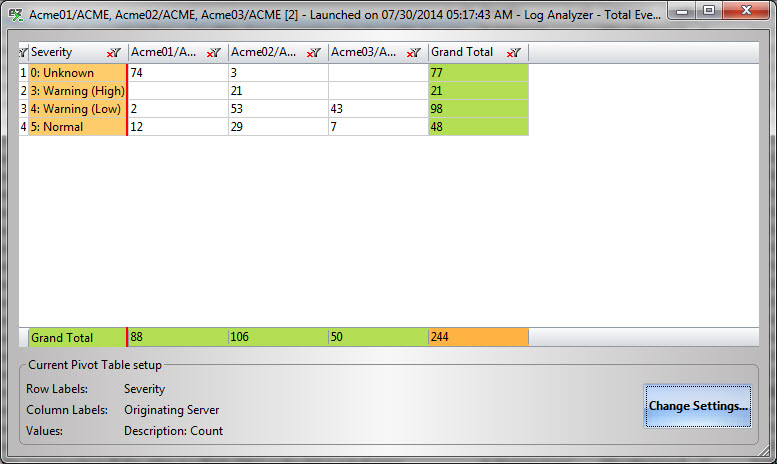
Fig. 5 The Log Analyzer can provide a quick picture of your servers’ overall health.
Example 3 – Which applications are the most heavily used and what network usage does this generate?
To answer these questions using the Domino Administrator, you’ll need to look up session documents for each user over a certain time range, sum up the relevant numbers and analyze your results. This can take an eternity. You could write an agent, but why bother when you can just start up the Usage Volume Analyzer in consoleEZ.
First we create a Volume Analyzer on our server and select the “Usage (Session Activity)” log category with a given time range.
The goal is to see the total bytes read and written per database and per user. To do this, we select:
- “Database accessed <Discrete>” as Rows,
- “User Name” as Columns,
- “Bytes Read <Discrete>” and “Bytes Written <Discrete>” as Values.
IMPORTANT: Since the database is provided by a discrete event in the log document, we must use a value which is also discrete. Otherwise the result will be inaccurate since the value will be repeated unnecessarily.
This type of pivot table reveals the grand total of network usage per user and per database (Fig. 6). Also, such a pivot table will help determine which user is responsible for the most network traffic.
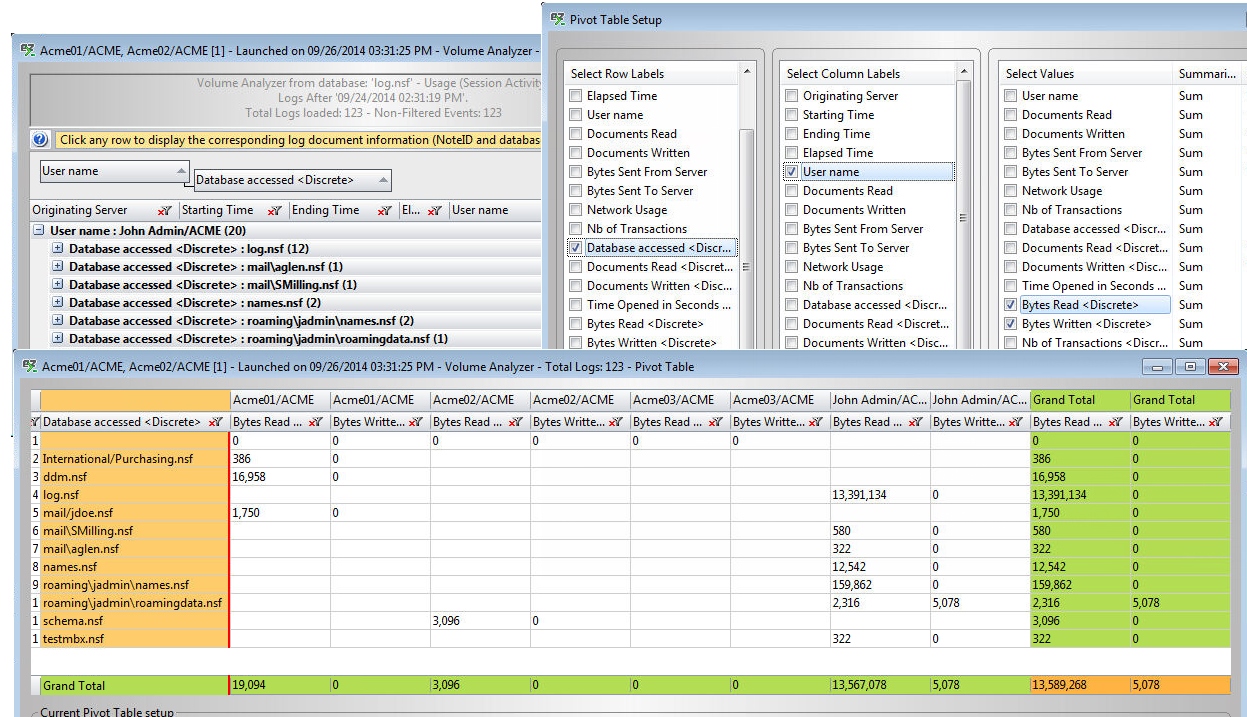
Fig. 6 Most heavily used applications and the Bytes Read and Written via the Usage Volume Analyzer.
If we want to use non-discrete values, we will need to set a “Unique Index”, so that the values are not used several times in the calculation (Fig. 7). This is because, as mentioned previously, non-discrete values are repeated on each discrete event.
In our example, if we want to see the global network usage per user per server, we will have to set the following:
-
- “User Name” as Rows,
- “Originating Server” as Columns,
- “Network Usage” as Values. We must also click on “[…]” in the “Unique Index” column, to select “Log Document NoteID” and “Originating Server”. This is necessary to ensure we use each value only once.
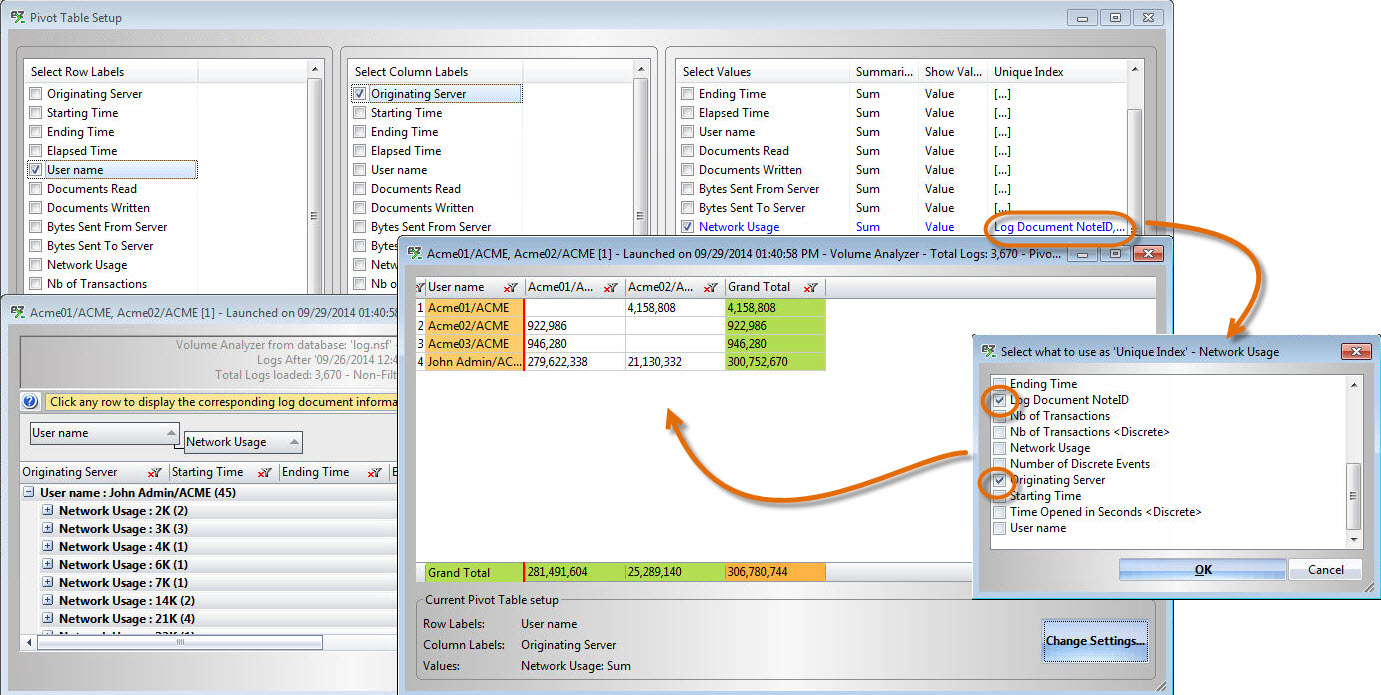
Fig. 7 Using non-discrete values in calculations requires selecting one or more “Unique Index” values in the pivot table setup of the Volume Analyzer.
Now that you understand how a log document stores information, should you ever find yourself adrift, consoleEZ can certainly show you the way by giving you access to important log file information and the tools to search through it and organize it in a meaningful way.
Submit a comment