Ytria tools grid user interface tips and tricks

A ‘grid’ interface is used extensively throughout the Ytria product line. On its surface, it’s a simple and intuitive means of displaying large amount of data using columns and rows. But if you dig a bit deeper, you’ll find this interface is equipped with a very extensive list of features. And once you get the hang of these features, the grid itself becomes a very flexible tool for analyzing, re-contextualizing and exporting your data.
So if you own a single Ytria tool—or especially if you own several of the tools—it’s well worth a moment of your time to get familiar with the grid interface. We’ll use this post to give you a brief tour of its features. (Note: Unless otherwise specified, all of the actions discussed are available in all grids via the right-click contextual sub-menu called ‘Grid Actions‘).
Where can I find these grids?
You’ll find the grid interface in the following places throughout the Ytria product line, including the following:
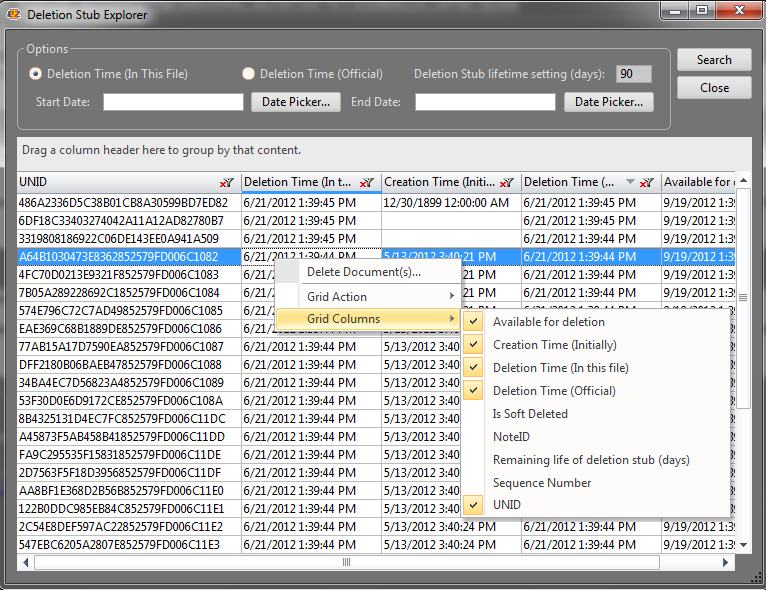
scanEZ: The Item List, the ‘Diff’ panel, the Values dialog, the Deletion Stub Explorer, the Replication and Post Replication Auditors, the Document Analyzer, the ACL panel and the User Activity dialog.
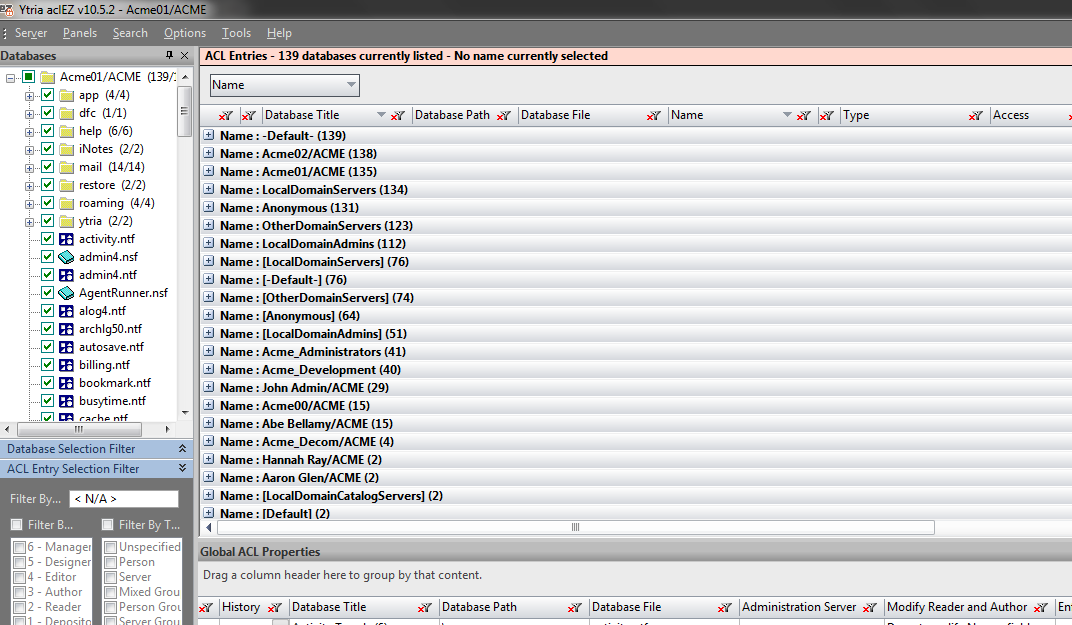
aclEZ: The main ACL grid, the ACL Entry Presence panel, the Roles panel, the Global ACL Properties panel, the Selected ACLs panel, and the NAB Group Navigator.
agentEZ: The main grid and the Show Agent Logs dialog.
databaseEZ: The main grid and the Property Analyzer Grid.
signEZ: The Audit/Signature Results dialog.
viewEZ: The Columns by Properties tab in the Columns dialog and the Views dialog (new in viewEZ 10.5!)
designPropEZ: The Search, Audit and Update Results dialog.
Note: the grid interface isn’t used in actionBarEZ but it will be used extensively in the upcoming replicationEZ tool.
Changing how data is organized in Grid windows
The following features allow you to look at the Lotus Notes and Domino data shown in your Ytria tools from different perspectives.
Grouping
The grid interface lets you drag column headers to the ‘grouping area’ in order to re-categorize the displayed data.
You can add two or more levels of grouping—in fact you can have as many levels as grouping as you like. We find column header grouping enormously helpful and we’re constantly finding new uses for it. The image below shows three levels of grouping in an aclEZ grid; with this example, we’re easily able to see the relationship between Access levels, ACL entries, and Database Types on our server.
The ‘drag a column header here to group by that content’ zone or ‘group box’ in grid-type windowsa
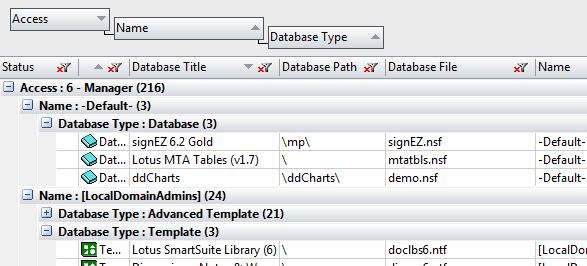
Here is an example of 3-tiered grouping. In this case we’re grouping by Access, Name, and Database Type in aclEZ
To remove active groupings, you can either drag the one-or-more of the grouped headers back to the top row, or you can click the Ctrl+Shift+G (Ungroup All) shortcut.
Sorting
This is the most straightforward (and likely, obvious) of all grid features: just click any column header to sort by its content, either ascending or descending. You can also click on any column headers in the group box to toggle sorting between ascending and descending for any active groupings. One not-so-obvious sorting feature is the ability to Shift+Left Click a column header to create a secondary level of sorting (can even Shift+Click additional column header to create 3rd, 4th and beyond levels of sorting).
Sort Groupings by Count
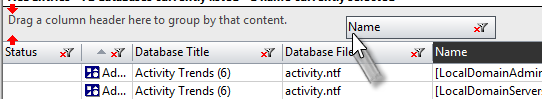
This option is used in conjunction with column header grouping; when active, groupings will be sorted by the number of grouped items rather than alphabetically. One handy example application for this would be grouping by the ‘Name’ header in aclEZ; by doing so you can sort the names by the number of databases that they’re present in on the server (see the image below).
Filtering Options
You have a number of ways to narrow down the information in grid windows when you click the ‘funnel’ icon on a column header. Quite often, grids in Ytria tools need to contain a considerable volume of information, so the filter options are handy when you need to find particular bits of data. The following three filter types are available:
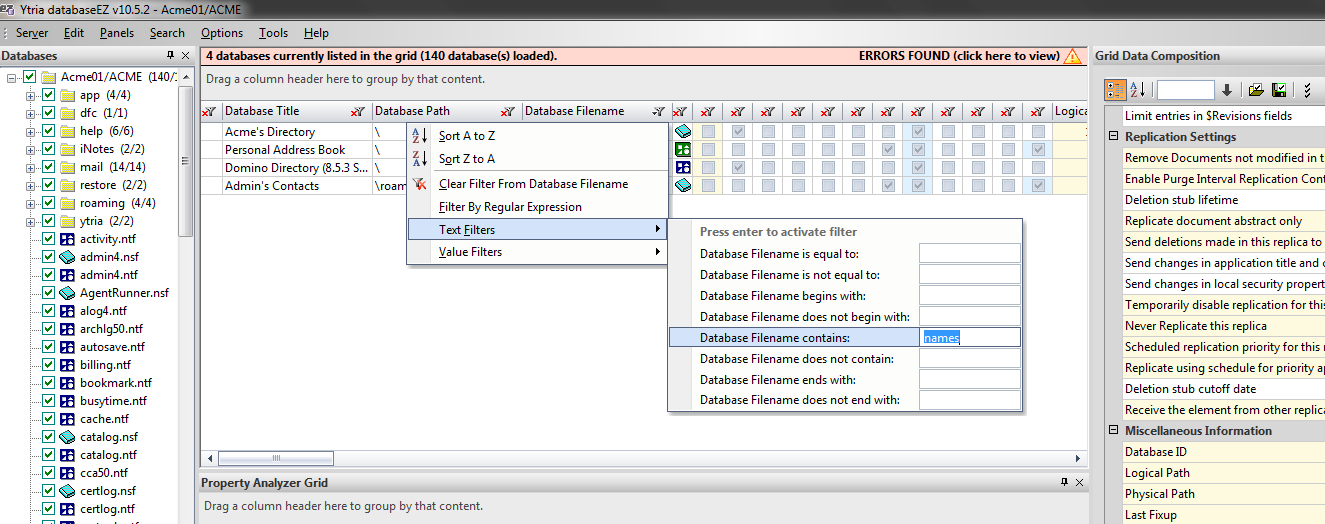
Text Filters: Text Filtering will let us narrow down the grid to entries that contain a given string in the column we are using the filtering on. The example shown here would help us quickly find databases in databaseEZ.
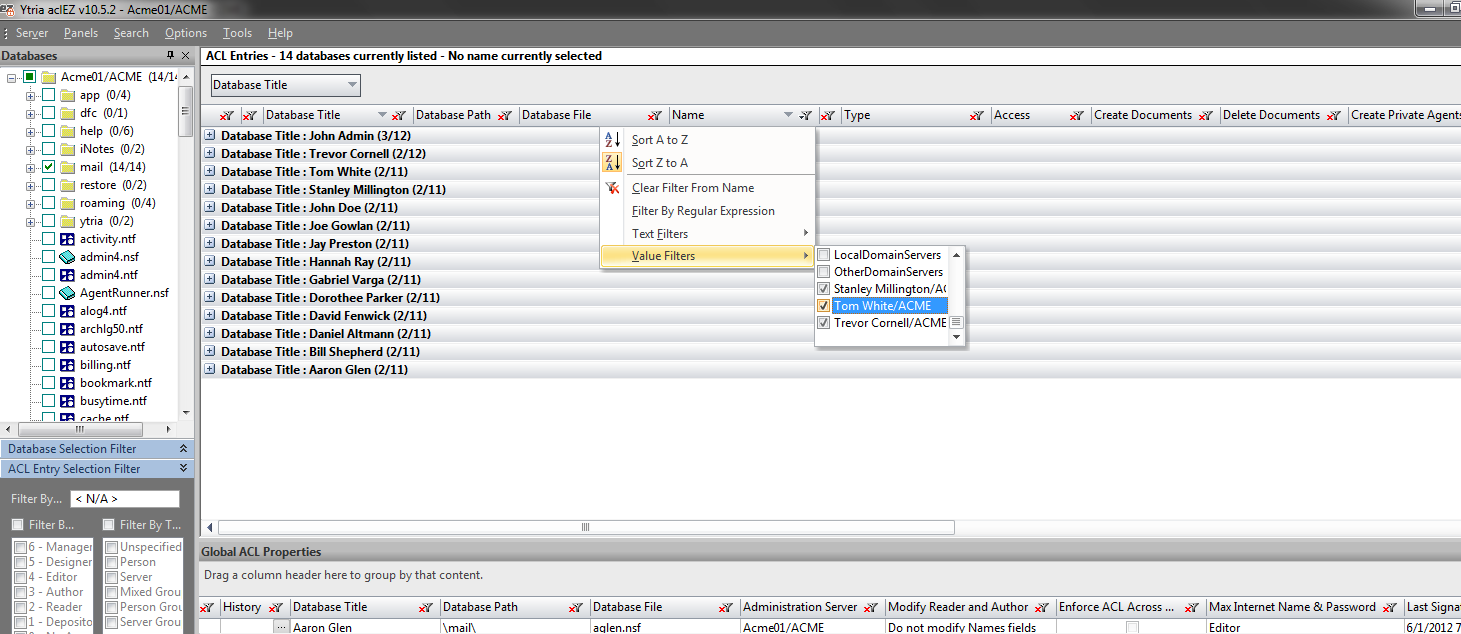
Value Filters: Value Filtering can be extremely useful in cases where we just want to remove certain entries from the grid in order to focus on what really matters. An example practical application of this might be how we can remove ‘standard’ ACL Entries (e.g. Server, Local Domain Admins, etc.) from the aclEZ grid and focus only on ACL Entries individually added to things like Mailfiles.
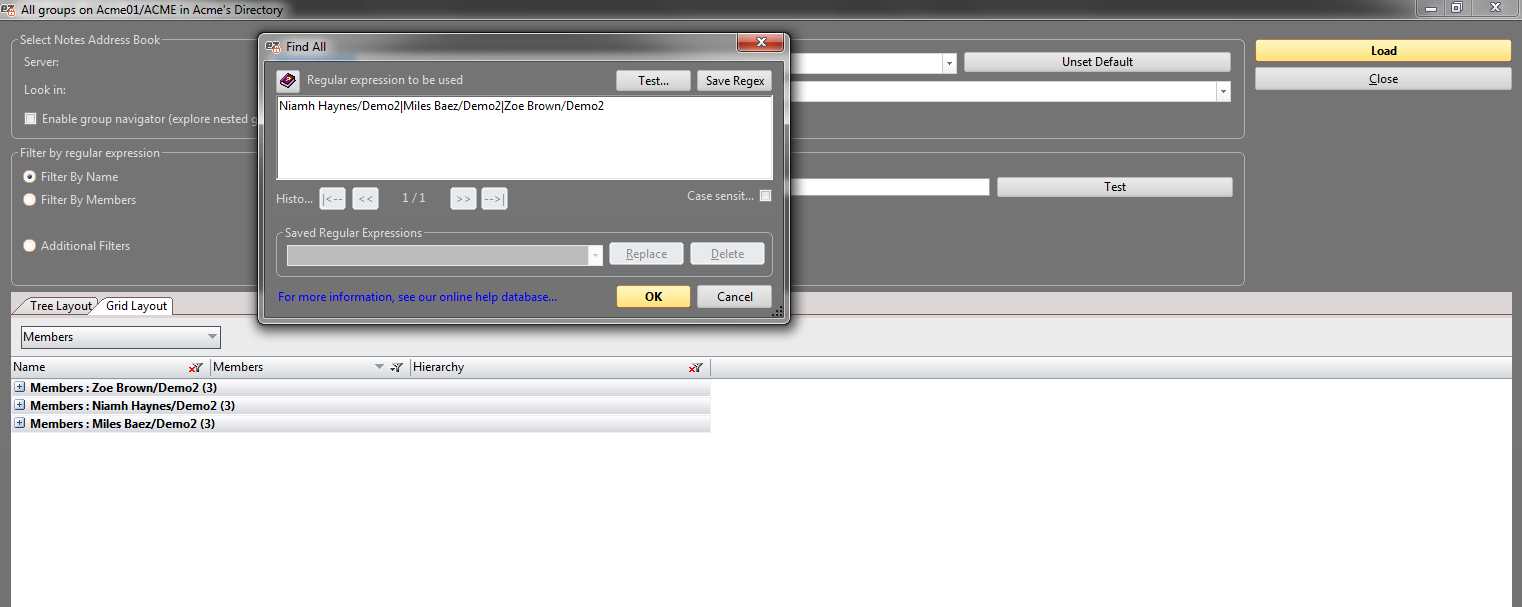
Filter by Regular Expression: This is an extremely flexible option. If you’re not familiar with regular expressions (regex), check out this guide. Once you know the syntax, the uses of regex filters are limited only by your imagination, but an example that immediately comes to mind would be to help us search through lists of users in the aclEZ NAB Group Navigator dialog; we can easily check the membership status of an ad hoc list of people against all Groups in the NAB.
Search Options
The following two search options are available in grid interfaces:
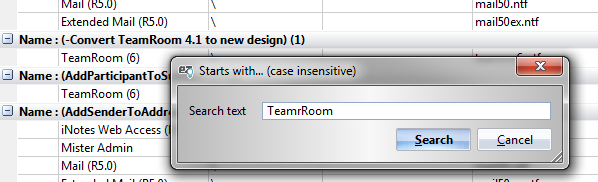
Type to Search: Simply start typing in a grid window to access a basic, case insensitive search dialog on the first sorted column (or grouping—groupings take precedent).
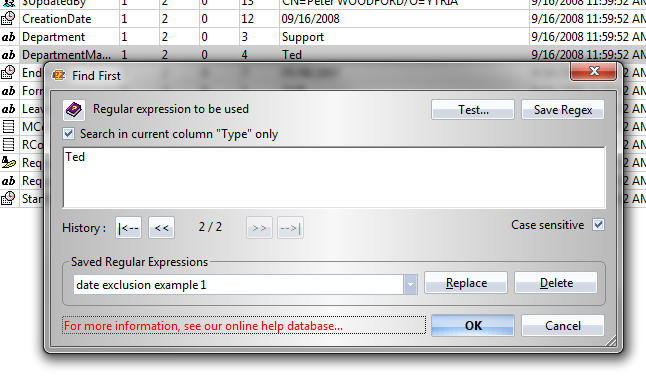
Find dialogs: Click Ctrl+F to open the more elaborate Find dialog. The following features are supported: Searches using regular expression; saving searches; recalling previous searches; toggling case sensitivity; and focusing searches on a single grid column.
Data Exportation Options in Grid windows
Notes professionals often need to keep track of what they are working on; the state of their environment; and what changes they have made. It’s seldom easy to report all of this using the native Domino tools. Being Notes users ourselves, we tried to make it as easy as possible to document whatever you are working on using Ytria grid interfaces. The following exportation options are available in all grids:
Copying and Pasting,
The simplest way to extract information from a grid window is to simply select the rows we’d like to export and click Ctrl+C to copy to the clipboard; data can be pasted into any modern spreadsheet application or text editor.
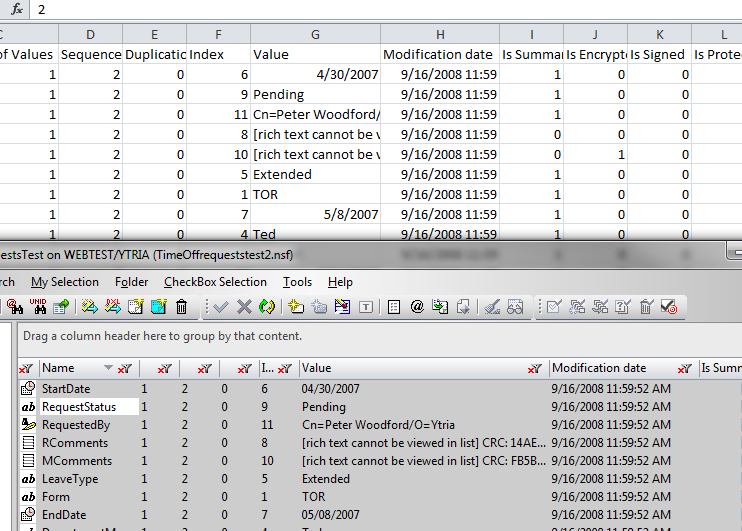
There are plenty of real world applications of this feature: you could copy and paste information to create instant server-wide reports on security, performance, agents or ACLs. Another handy use might be to take key Item values across a collection of documents (displayed in scanEZ’s Values dialog) and paste them to Excel for further analysis. (Bonus tip: scanEZ’s Values dialog also offers a ‘Show Field Type Columns’ box which you may want to uncheck before copying the grid to the clipboard).
Exporting to File
There might be instances where the simple copy/paste won’t be enough. We offer additional options using the right-click>Grid Actions>Export feature (also Ctrl+Shift+E). If we, say, needed to create a report about the number of scheduled agents per databases on our servers, we could use the Pre-Formatted Text File – Selected Rows only export option. We could group by Databases in the main agentEZ grid.
Our grids support the following export formats: HTML; HTML (Selected Rows); Pre-formatted Text File (WYSIWYG); Pre-formatted Text File (Export only children); Pre-formatted Text File (Selected rows only); Pre-formatted Text File (Export only children of selected rows). These options help us fine-tune the data exportation to the task at hand.
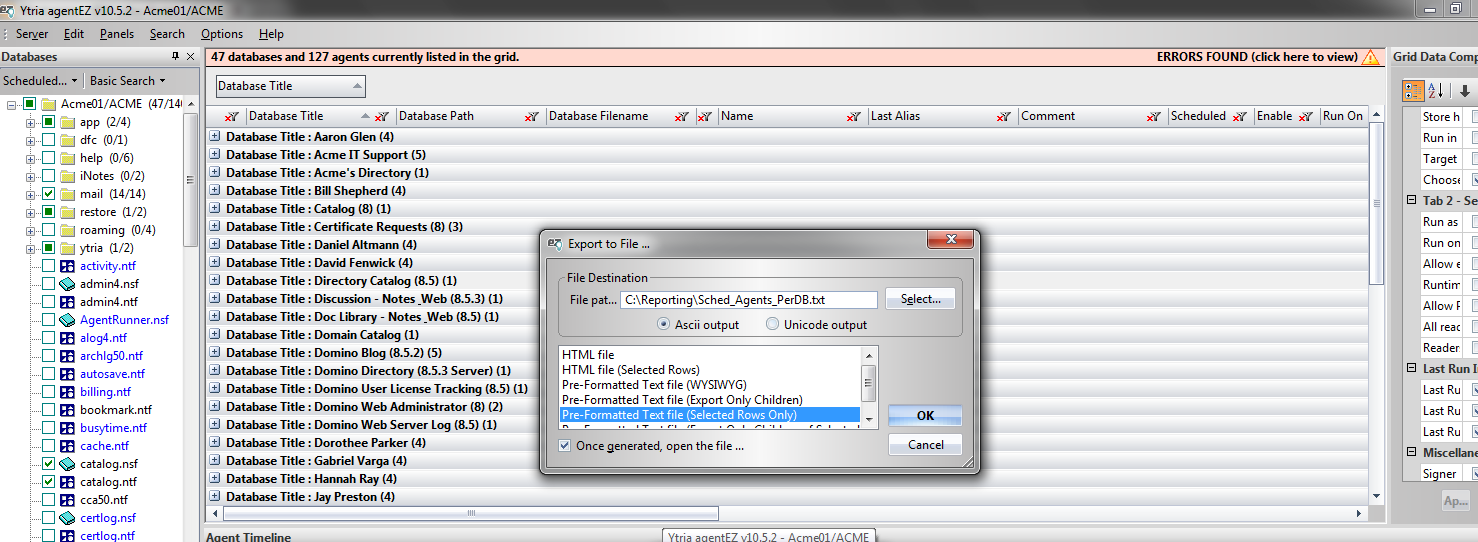
You have numerous ‘export to file’ options in grid windows
Customizing the information shown in Grid windows
Date, Time and Size Formatting,
Wherever a grid-type window displays date and time or data size information, you have the option of customizing how this information is displayed. Once customized to your specifications, it’s much easier to sort and filter for a given task at hand.
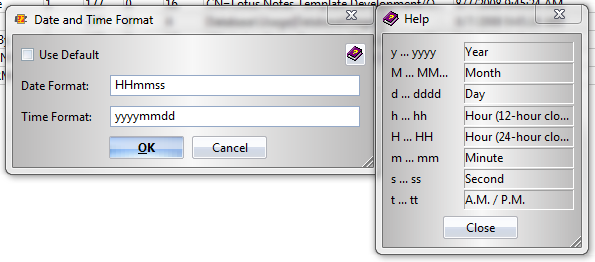
Customizing date and time formatting:
By default, grid windows will display data and time using your Windows default setting, but if the need arises you can customize this display to fit your needs.
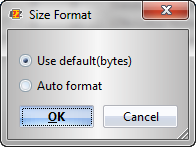
Customizing Size format: this allows you to choose between the default display of bytes for data or ‘auto form
Adding and removing column headers
You’ll also find a handy ‘Add Columns to Grid‘ option in the Grid Actions section of the right-click contextual menu. This option will open a floating window where you can drag column headers to and from in order to customize the data shown in your grid. Alternatively, you can check and un-check columns with the Grid Columns right-click menu.
Removing columns is particularly is handy when using the export data options mentioned earlier since it allows us to include only the data that matter for your given task.
Tip: If you accidentally remove a column header by pulling and dragging it, the Add Columns to Grid window will let you restore it (just drag the header back to where you want it).
Grid Data Composition
The administration tools agentEZ and databaseEZ add another grid feature called the Grid Data Composition panel. This differs from the normal ‘add and remove columns’ mechanism that’s universally available in grid windows because it affects which data is loaded; for optimum performance, it’s a good idea to select only the properties that we’re interested in.
Column Freezing
Introduced in the version 10.0 update, the Column Freezing option is a great way to keep key information visible when your grid contains large numbers of columns. The databaseEZ main grid interface, for example, is capable of displaying over 115 Database Properties. If we decide to show all of those properties in the grid, scrolling across columns could get quite unruly. To make things a tad easier to follow, we might want to freeze certain key properties like the Database Title and Path, so they’re always visible. To use column freezing, you can either click Ctrl+F4 to freeze up to the currently selected column; or F4 to freeze all columns; Ctrl+Shift+F4 will undo freezing in the grid.
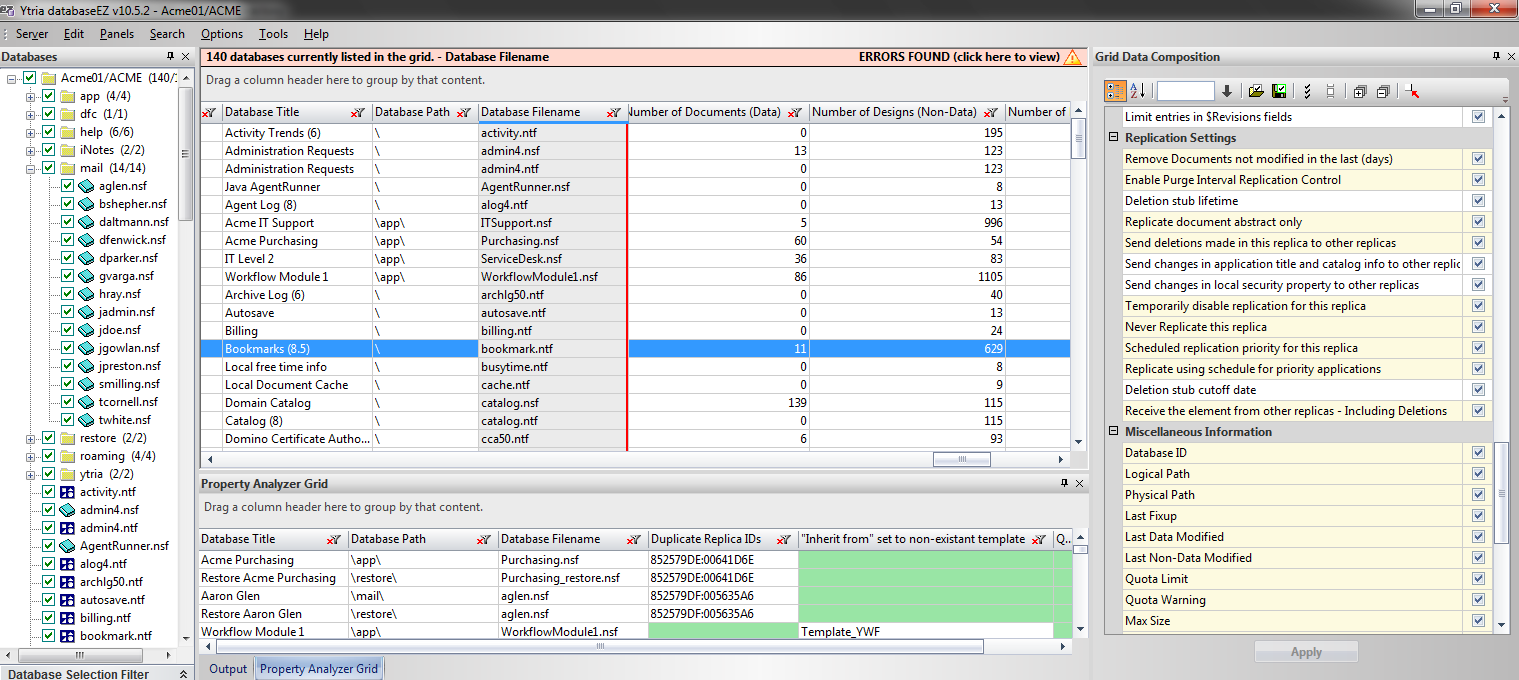
When Column Freezing is engaged, columns to the left of the red line will remain v
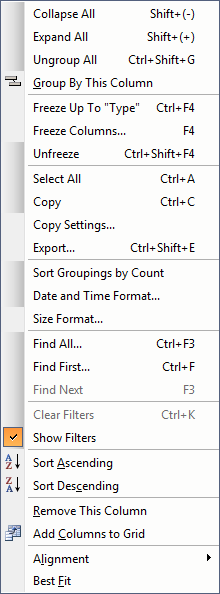
The Grid Actions Contextual Menu and Keyboard Shortcuts
The following right-click contextual menu is available in all grouping grid dialogs (note the keyboard shortcuts available):
Submit a comment