Which Departments are Mastering Working from Home? How to Find Out

With most organizations switching their staff to remote work these days, department managers have an increased responsibility to oversee their staff’s engagement.
Certain departments may be mastering the idea of working from home and are becoming even more productive. But how do you know which ones? Tools such as sapio365 can provide busy IT departments with quicker and easier ways to find out, all in just a few clicks.
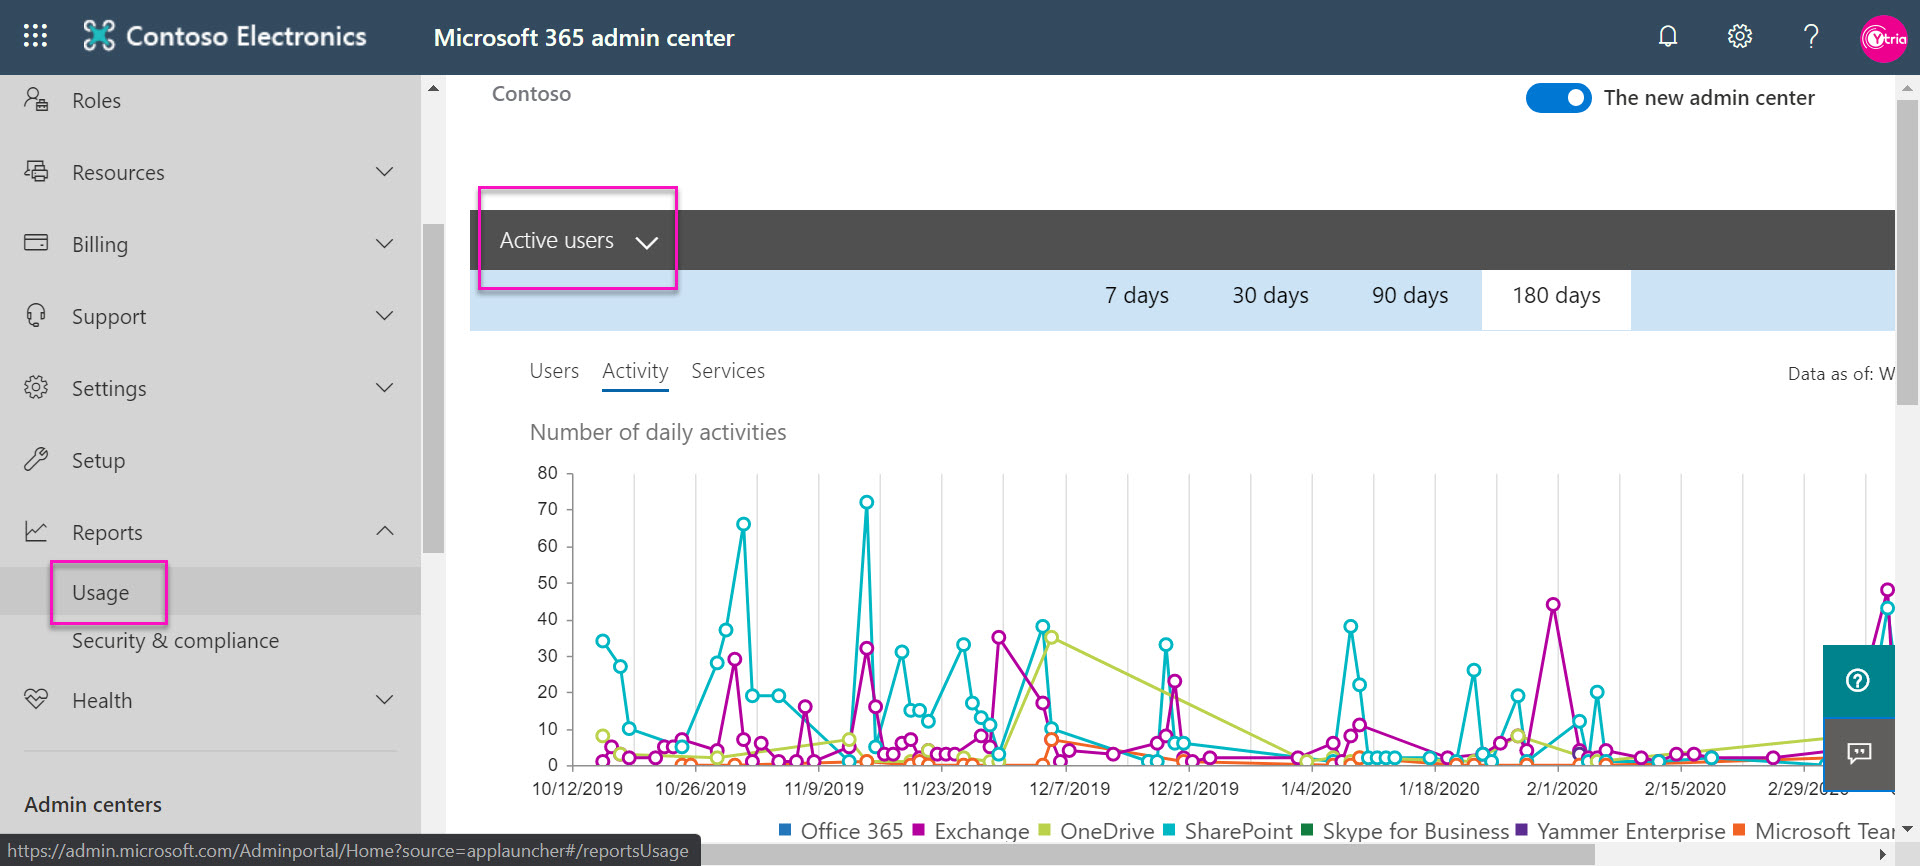
For example, when your department heads ask how they can be sure that employees are signing into Office 365 to do their work, you can confidently volunteer to give them a report based on the Office 365 Active Users usage report in the admin portal.
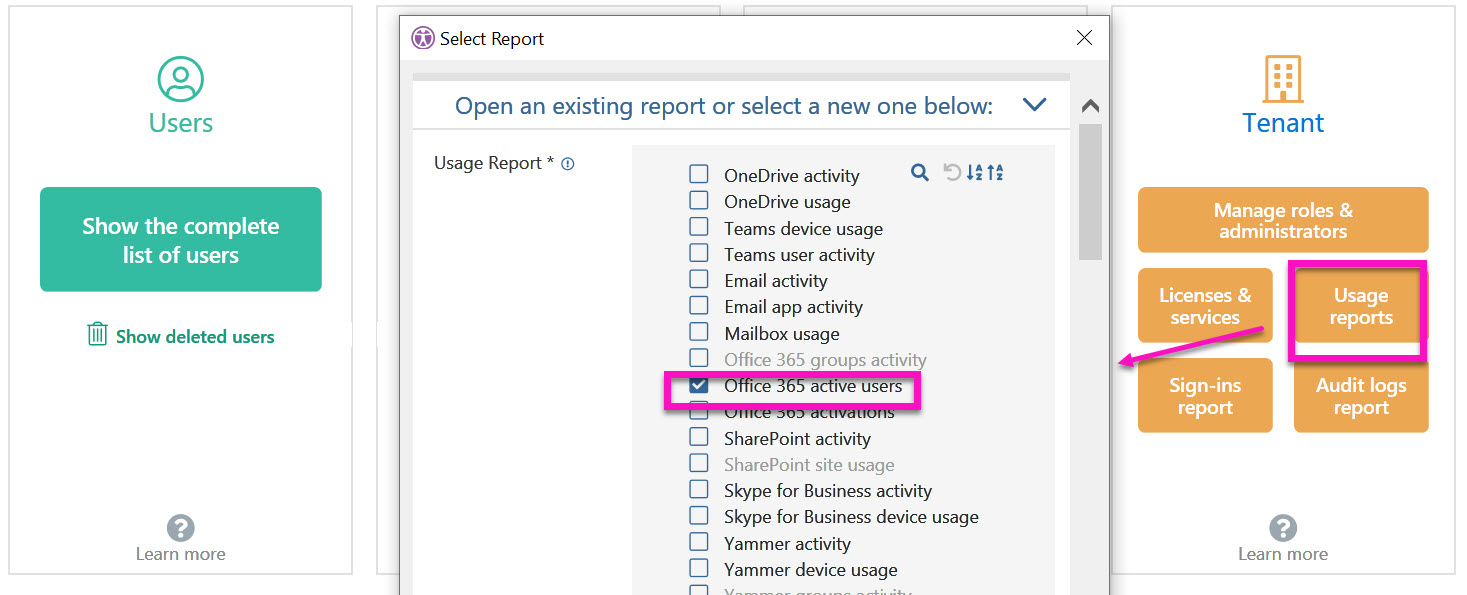
Considering that you need a report for each department, you’ll need to compile a list of active users per department. You can create a custom filter to narrow the list by department, or you can export your users to a csv file and then create lists per department.
Then you’ll have to match the user in the usage report. You’ll also have to figure out how to get the most recent date of all the services listed for each user, so your best bet is to export the data and use some pretty crafty lookup formulas in Excel.
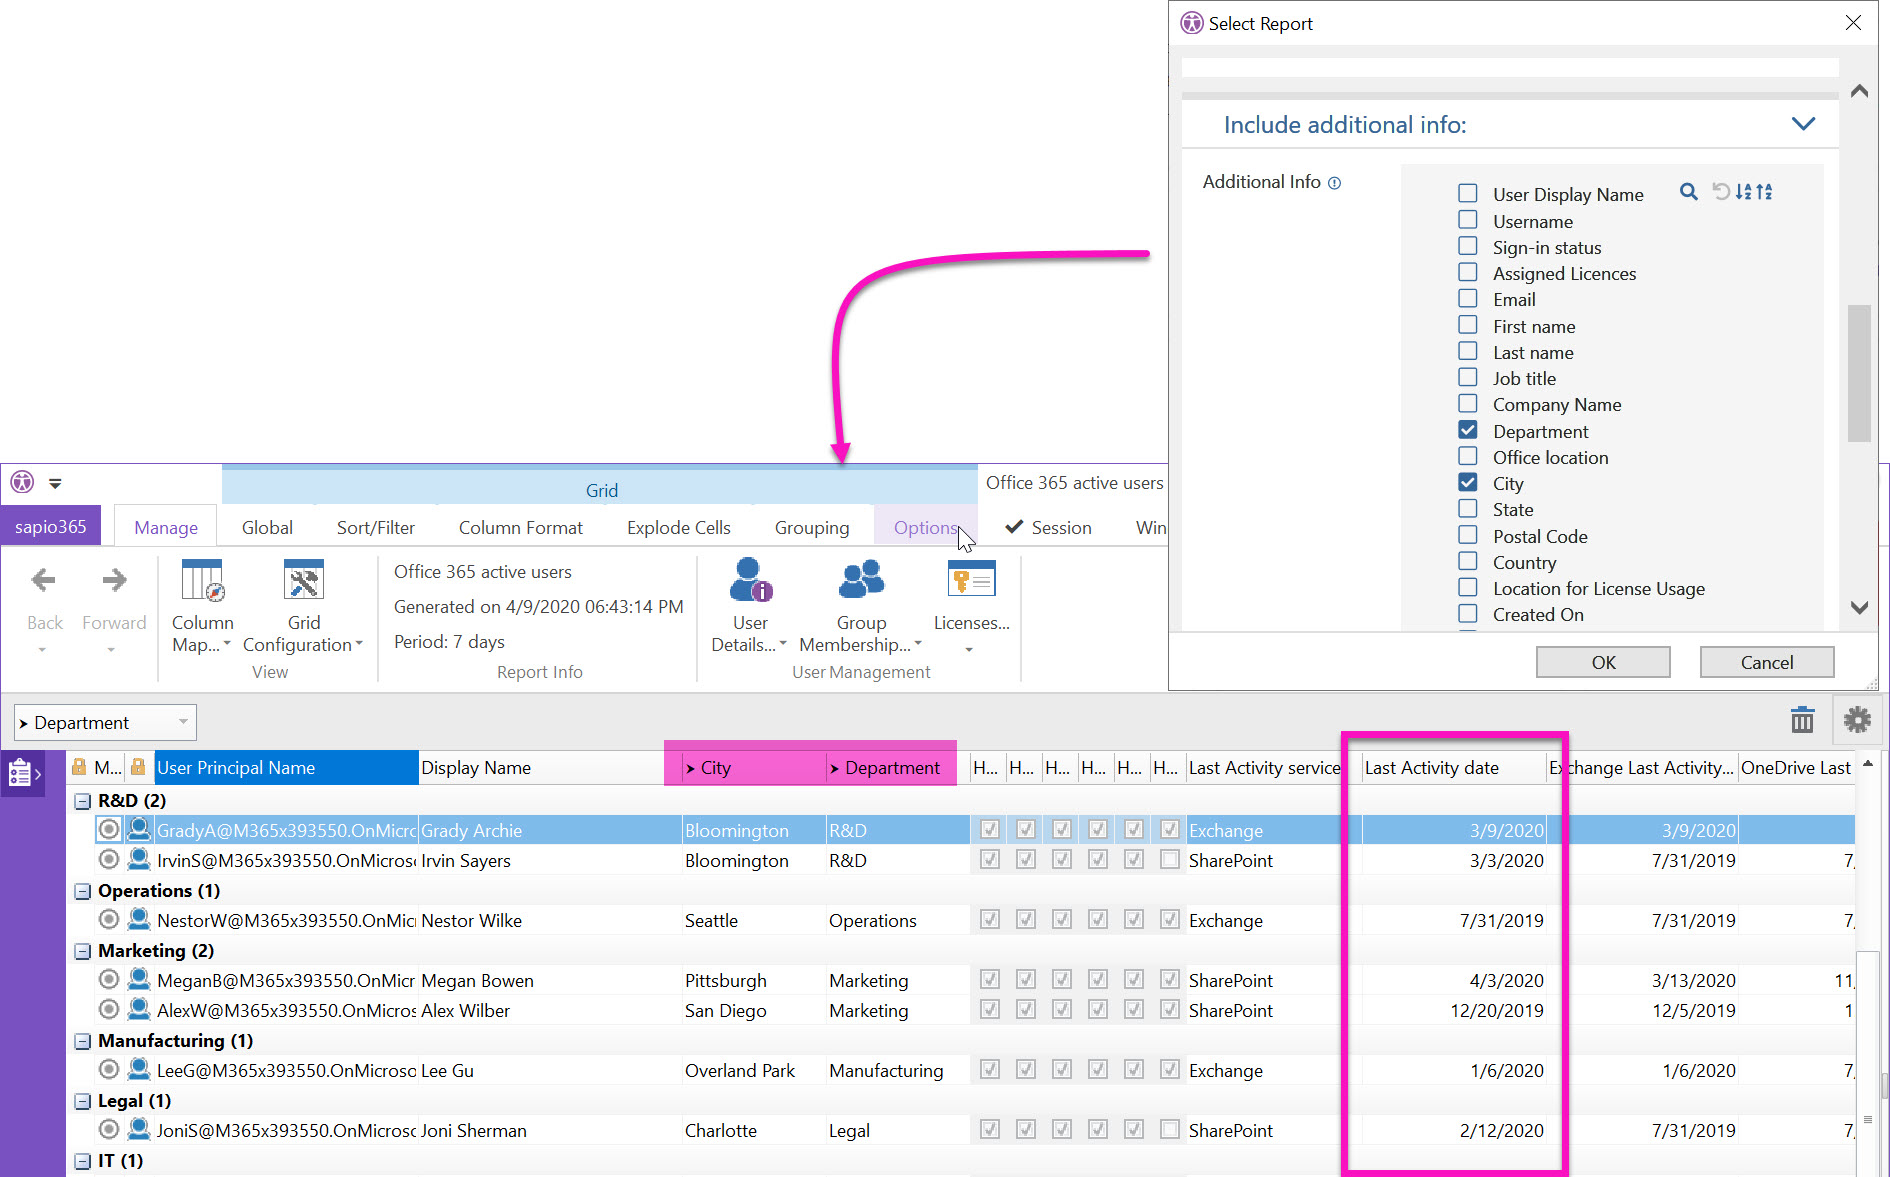
Now scroll down and you’ll see that you can pick various user properties like ‘Department’, ‘City’, etc.
What you get is the same report as the one you exported from the admin portal except now you will also have the users’ departments and city info (pink highlight).
A quick grouping by the department and now you have everything you need to create reports tailored for each department. Computed columns ‘Last Activity date’ and ‘Last Activity service’ give you the latest activity info for each user.
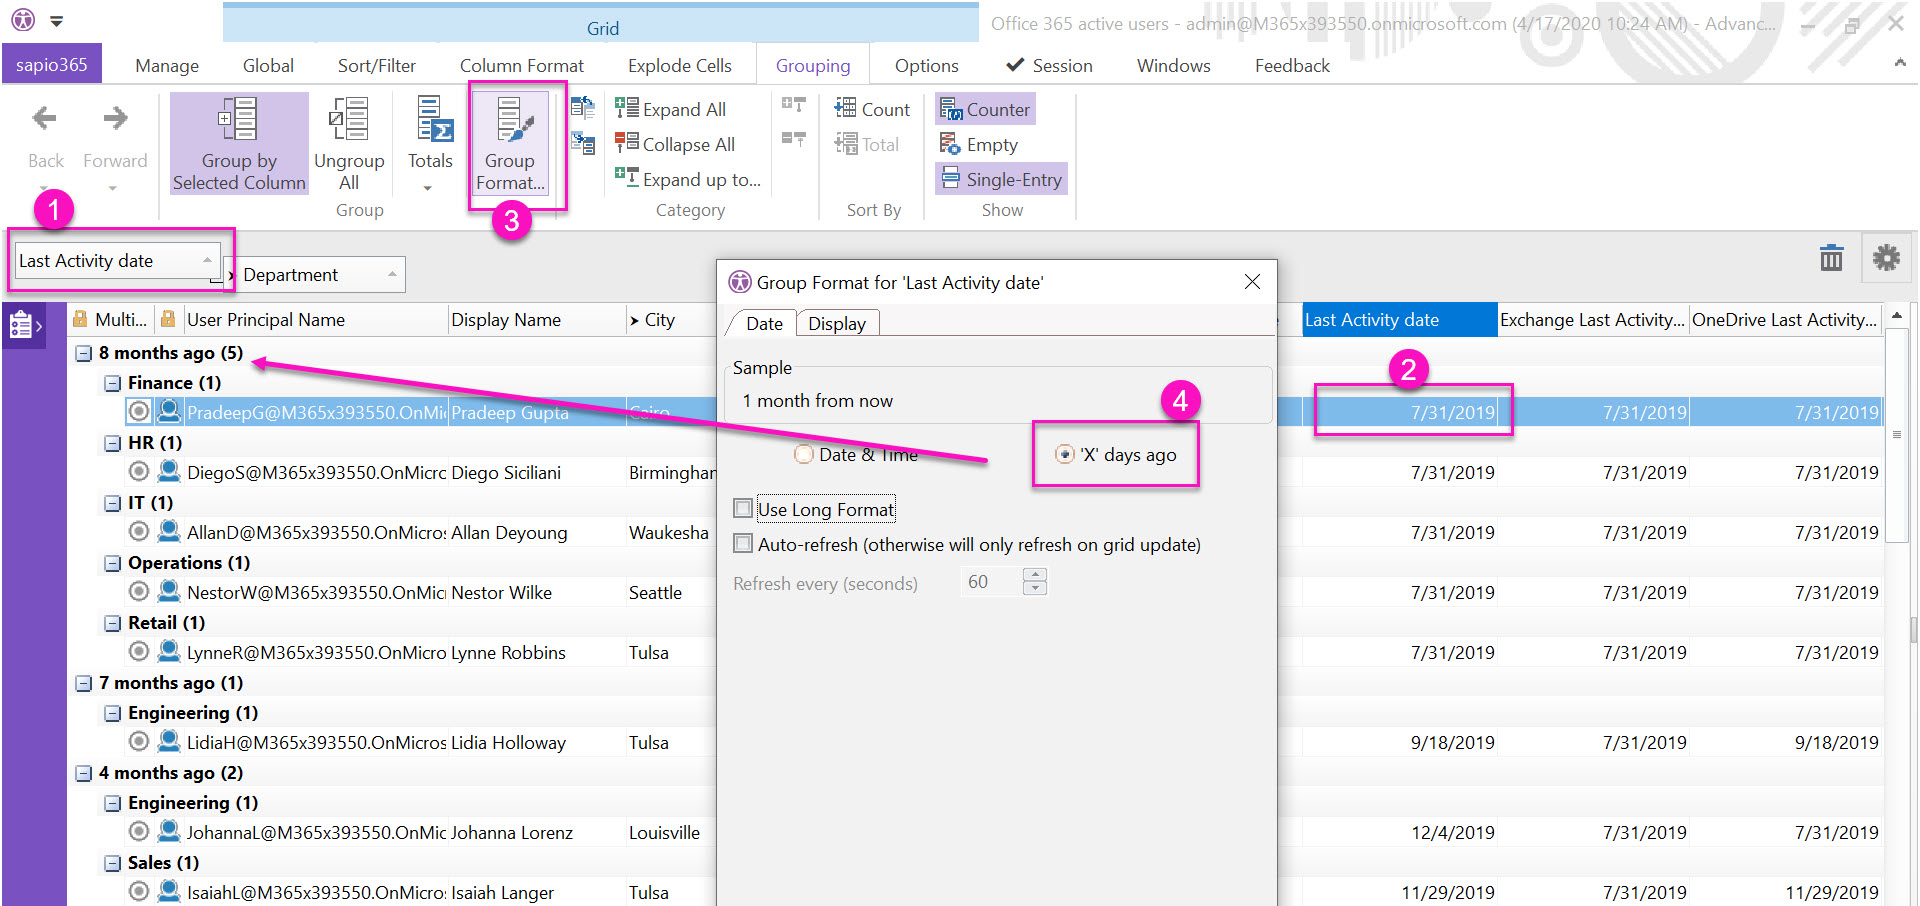
Another way to organize date-driven data is by categorizing by the date (1) and changing the setting for that column grouping to a broader time period. Select a cell in the date column (2), click on ‘Group Format’ in the Grouping tab (3) and change the setting (4).
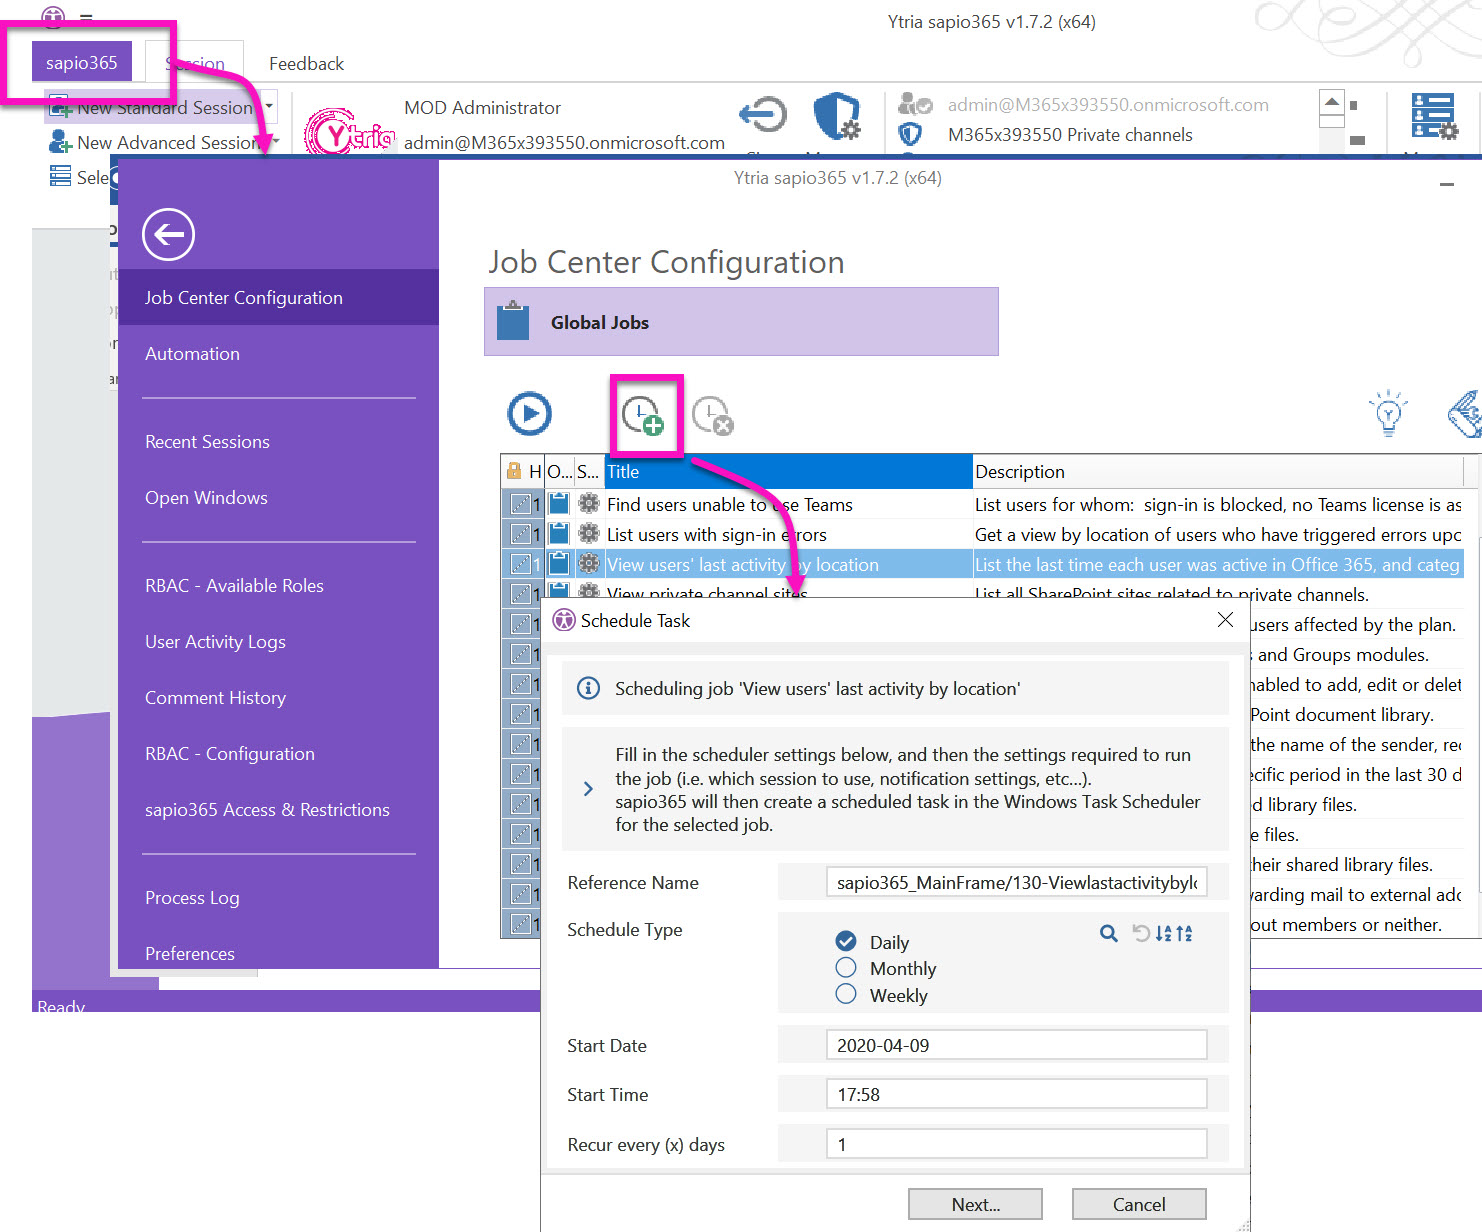
Since anything in sapio365 can be automated, we created a task that gives you this same result. You can access it from our featured jobs. Just follow the arrow!
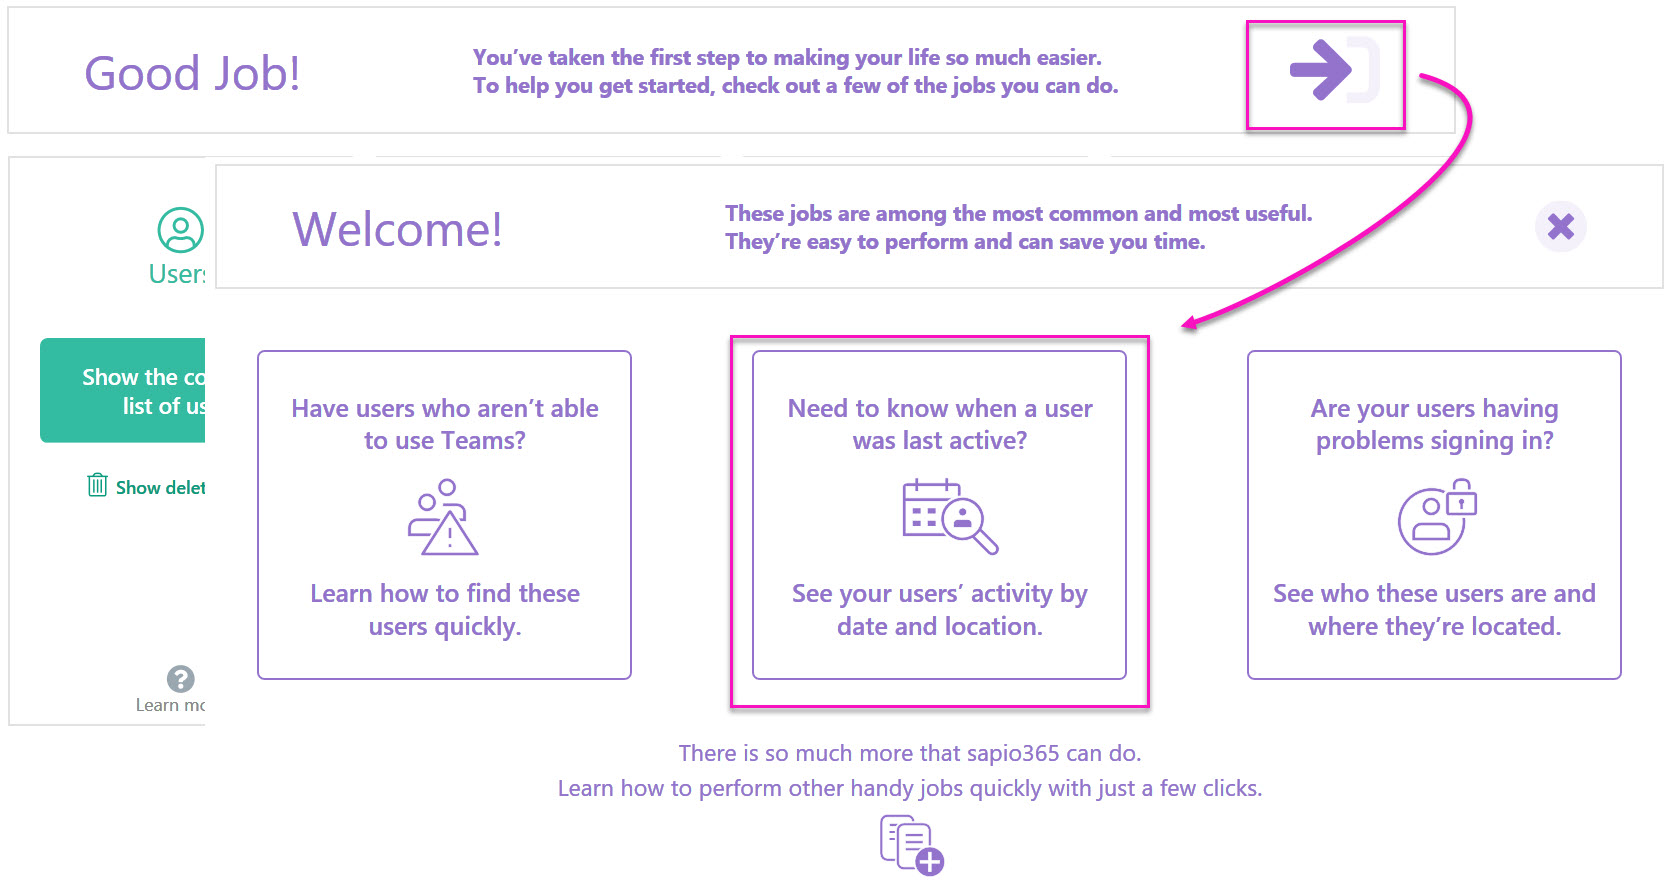
Run a weekly usage report in sapio365
Another great benefit is that you can decide to schedule this task in sapio365 and get a report in your inbox with your users’ last activity date categorized by department or location – it’s up to you!
So in addition to helping you avoid the hassle of depending on PowerShell to bridge all the info you need together, all the steps in sapio365 have been automated to deliver the results to your inbox. You don’t have to wait while sapio365 processes everything, you can just set it and forget it!
With just a few clicks in sapio365, you can resolve problems you may not even know you have. sapio365 is like your own personal genie in a bottle, allowing you to save time and get more done with just a few clicks of the mouse and no code.
To learn more about what sapio365 can do, why not try it free?
Submit a comment