Value Formatting Options
When setting up your pivot table in the Pivot Table Setup dialog, special considerations can be made regarding the format of the Values themselves, the way totals will be calculated, and the context given to each type of Value.

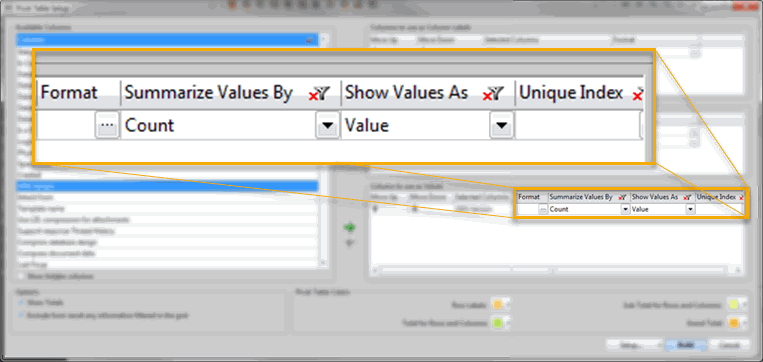
- Format: This opens a Cell Format dialog for the specific Value type where you can set the format for the display of number values as well as cell colors.
- Summarize Values By: This lets you set the way your totals will be calculated according to the Group Totals option logic.
- Show Values As: This dropdown list lets you choose between displaying your Values as their actual numerical value, or as a percentage of the Totals as calculated in your pivot table.
- Unique Index: Lets you correlate a Unique Index with your Values when building your pivot table. For more information on unique indexes, see this page.
| Note | The choices available for the 'Summarize Values By' option will change according to the type of values being summarized.
Number values will have the choices Sum, Average, Minimum, Maximum, and Count.
Non-number values will be summarized by Count. |
|---|
More About the 'Show Values As' Option
For example, re-building the ODS Version pivot table pictured in the Pivot Table Overview with '% Of Row Total' selected...

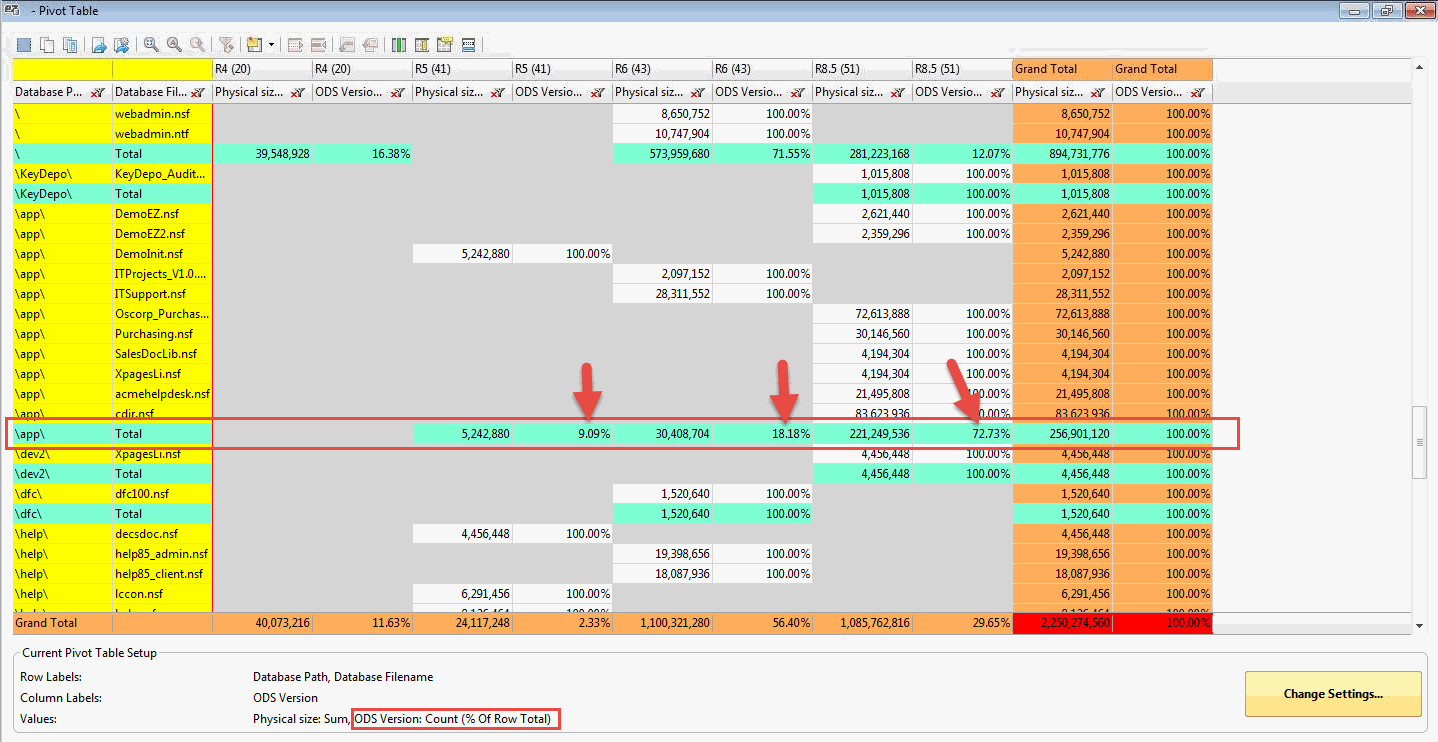
...will yield the following results in the new pivot table.

ODS Version Values are still calculated in a 'Count' number format, but they are each displayed as percentage of the total amount in the row. Thus, the subtotals for each ODS version found in the group of databases using the path '\app\' appear as percentages of the total amount of ODS versions shown in the row.
- Databases using ODS version 41 make up 9.09% of the total.
- Databases using ODS version 43 make up 18.18% of the total.
- Databases using ODS version 51 make up 72.73% of the total.